


Dexcom, Inc. (DXCM): Comprehensive Investment Analysis
Not held

Dexcom, Inc. stands as a pioneer and prominent leader in the rapidly expanding Continuous Glucose Monitoring (CGM) market, primarily serving the diabetes patient population. Over the past five years (FY2020-FY2024), the company has demonstrated robust revenue growth, driven by increasing CGM adoption, successful product launches (G6, G7), and geographic expansion. Revenue grew from $1.93 billion in FY2020 to $4.03 billion in FY2024, although growth decelerated to 11% in FY2024 from rates exceeding 18% in prior years.Profitability has improved significantly from earlier periods, with consistent positive operating and net income since FY2020. However, recent margin trends present a mixed picture. While operating income grew to $600 million in FY2024, operating margins contracted to 14.9% from 16.5% in FY2023, and gross margins declined steadily from ~69% in FY21 to ~60.5% in FY24. Recent quarterly results (Q1 2025) showed re-accelerating organic revenue growth (14% YoY) but further pressure on non-GAAP gross (57.5%) and operating (13.8%) margins, attributed by management to near-term supply dynamics and inventory rebuilding costs.Strategically, Dexcom is focused on expanding its addressable market by targeting Type 2 diabetes patients (basal and non-insulin users) through enhanced market access (recent PBM/Medicare coverage wins) and new products like the OTC Stelo sensor. Continued innovation, exemplified by the recently FDA-cleared G7 15-day sensor, aims to maintain technological leadership against key competitors Abbott and Medtronic. The company maintains a strong balance sheet with significant liquidity ($2.6B cash & equivalents at YE 2024) and moderate leverage, primarily through convertible notes. A new $750 million share repurchase program was announced in Q1 2025.Valuation analysis using a Discounted Cash Flow (DCF) model suggests an intrinsic value of approximately $85 per share, indicating the stock is currently trading slightly below this estimated fair value (based on a ~$80 share price at time of analysis). This assumes a gradual recovery in operating margins towards 23% and long-term revenue growth tapering to 3%. The 5-year forward IRR is projected at approximately 13.5%, slightly above the calculated WACC of 12.0%, suggesting potential for modest risk-adjusted returns.The core investment thesis centers on Dexcom's strong position in a large, underpenetrated growth market, offset by near-term margin pressures and execution risks associated with scaling and competition. The business is improving its market access and product portfolio but facing challenges in translating top-line growth into consistent margin expansion recently. Recommendation: Hold. While the long-term growth story remains compelling, the recent margin compression warrants caution. Investors should monitor margin trends, the successful launch and adoption of the G7 15-day sensor and Stelo, and competitive dynamics closely in the coming quarters. Key risks include intensifying competition from Abbott, failure to achieve margin improvements, reimbursement pressures, and manufacturing/supply chain disruptions.
1. Dexcom: Business Profile and Market Landscape
1.1. Business Model and Product PortfolioDexcom, Inc. operates as a medical device company focused on the design, development, and commercialization of Continuous Glucose Monitoring (CGM) systems. Founded in 1999 and publicly traded since 2005, Dexcom has been a significant force in advancing glucose biosensing technology for over two decades. The company's stated mission is to empower individuals to take control of their health through its innovative technologies, primarily targeting diabetes management.
The core of Dexcom's business revolves around its CGM systems, which provide real-time glucose readings, trends, and alerts to users, typically via a sensor inserted under the skin, a transmitter attached to the sensor, and a display device (smartphone app or dedicated receiver). Key product generations include:
Dexcom G6: Launched in 2018, the G6 system was a significant product, offering factory calibration (no routine finger sticks required, 10-day sensor wear, and connectivity features.
Dexcom G7: Representing the next generation, G7 received FDA clearance in late 2022 and rolled out through 2023 and 2024. It features a smaller, all-in-one sensor/transmitter design, a shorter warm-up time, improved accuracy, and retains the 10-day wear and no-fingerstick calibration.
Dexcom ONE+: Launched in 19 international markets during 2024, Dexcom ONE+ utilizes the G7 hardware platform but is tailored for broader access, potentially at different price points or feature sets for specific international markets. It recently secured reimbursement in France for certain Type 2 patients.
Stelo: Launched in August 2024, Stelo is Dexcom's first glucose biosensor available over-the-counter (OTC) in the U.S., specifically designed for adults with Type 2 diabetes who do not use insulin. It features a 15-day sensor wear time.
Dexcom G7 15-Day: Received FDA clearance shortly after Q1 2025 (April 2025) for individuals 18+. This system extends the wear time of the G7 platform, aiming to enhance user convenience and potentially improve cost-effectiveness. A U.S. launch is planned for the second half of 2025.
Dexcom consistently emphasizes key features like eliminating the need for routine fingerstick calibrations, providing customizable high/low glucose alerts and alarms, enabling data sharing with caregivers and healthcare providers, and integrating with other diabetes management technologies like insulin pumps (from partners like Tandem Diabetes Care and Insulet) and digital health platforms (e.g., a partnership with ŌURA announced in Q4 2024). This focus on innovation and integration underpins Dexcom's strategy to maintain a leading position in the market. The evolution towards longer sensor wear times (from 10 days for G6/G7 to 15 days for Stelo/upcoming G7) is a critical competitive response, particularly to Abbott's Libre system, and is anticipated by the company to improve margins over time.
1.2. Revenue Streams and Customer Base
Dexcom's revenue generation is predominantly tied to its CGM systems, operating on a recurring revenue model driven by the need for users to regularly replace disposable components.
Revenue Components: The primary source of revenue is the sale of disposable sensors, which need replacement every 10 or 15 days depending on the product generation. Reusable hardware, mainly transmitters that attach to the sensors and relay data, constitutes a smaller, secondary revenue stream. In 2023, sensors accounted for approximately 90% of revenue, with hardware making up the remaining 10%. This is further evidenced by Q1 2025 results where sensor revenue grew 17% YoY while hardware revenue declined 42% YoY. Software applications (mobile apps for viewing data) are essential for the user experience but are not typically a direct, separate revenue source.
Geographic Distribution: Dexcom operates globally, with revenue segmented into U.S. and International markets. The U.S. remains the largest market, accounting for 72% of total revenue in Q1 2025. Historically, U.S. growth has often outpaced international growth, although both regions contribute significantly. In FY2024, U.S. revenue grew 10% while International revenue grew 15% reported (17% organic). In Q1 2025, U.S. revenue growth accelerated to 15%, while International growth was 7% reported (12% organic).
Customer Profile: Dexcom's technology serves individuals managing diabetes, encompassing both Type 1 and Type 2 diabetes populations. Historically, the focus was heavily on insulin-intensive users (Type 1 and Type 2 on multiple daily injections (MDI)). Increasingly, the company is targeting the larger Type 2 market, including those on basal (long-acting) insulin only and, with the launch of Stelo, those not using insulin at all. Dexcom reported significant customer base growth, reaching approximately 2.8-2.9 million users globally by the end of 2024, a ~25% increase during the year. Expanding the prescriber base is key to reaching these new patient populations; Dexcom added over 50,000 new prescribing physicians in 2024, focusing on primary care providers (PCPs) who manage the majority of Type 2 patients.
The business model's heavy reliance on recurring sensor revenue underscores the importance of user acquisition, retention, and adherence. The geographic trends suggest strong ongoing momentum in the core U.S. market, potentially boosted by recent coverage expansions, while international growth remains robust but can be influenced by factors like launch timings (e.g., Dexcom ONE+ rollout) and reimbursement dynamics in different countries. The strategic push into the Type 2 market, particularly non-insulin users via Stelo, represents a major expansion of the target customer base.
1.3. Continuous Glucose Monitoring (CGM) Industry Dynamics
The market for Continuous Glucose Monitoring systems is dynamic and exhibits strong growth characteristics, underpinned by significant unmet medical needs and ongoing technological innovation.
Market Size and Growth: The CGM market is substantial and expanding rapidly. Estimates suggest the U.S. market reached $3.7 billion in 2024 and is projected to more than double to $8.4 billion by 2033, implying a compound annual growth rate (CAGR) of 9.5%. Other analyses place the global CGM market above $10 billion in 2024, with projected CAGR between 8% and 13% through 2030. This growth is fueled by the increasing global prevalence of diabetes and the demonstrated clinical benefits of CGM over traditional blood glucose monitoring (BGM) methods, such as improved glycemic control and reduced hypoglycemia.
Market Penetration: Despite rapid growth, CGM technology remains significantly underpenetrated across the eligible diabetes population. While adoption is higher among Type 1 diabetes patients, penetration rates among the much larger Type 2 population are still relatively low. Estimates from late 2024 suggest U.S. penetration is around 60% for Type 1, 50-55% for Type 2 intensive insulin users (IIT), 20-25% for Type 2 basal-only users, and less than 5% for Type 2 patients not using insulin but at risk of hypoglycemia. International penetration rates are generally lower than in the U.S.. This indicates a substantial runway for future growth as awareness increases, technology improves, and access expands.
Key Industry Trends: Several trends are shaping the CGM market:
Shift from BGM: CGM is increasingly becoming the standard of care, replacing traditional fingerstick-based BGM for many patients.
Technological Advancement: Continuous innovation focuses on improving sensor accuracy, reducing size and calibration needs, extending wear duration, and enhancing user experience through software and connectivity.
Market Expansion: A major focus is expanding CGM use beyond intensive insulin users to include Type 2 patients on basal insulin and even those not using insulin, as well as exploring potential applications in prediabetes and general wellness.
Integration: Connectivity with insulin pumps for automated insulin delivery (AID) systems and integration with broader digital health ecosystems (wearables, health apps) are becoming increasingly important.
Accessibility: Efforts to broaden reimbursement coverage (e.g., Medicare expansion for basal users) and the introduction of OTC options aim to make CGM more accessible and affordable.
Dexcom operates within this favorable industry context, benefiting from the overall market growth while also contributing to it through innovation and market expansion efforts. The large untapped potential, particularly in the Type 2 diabetes segment, represents Dexcom's primary long-term growth opportunity.
1.4. Competitive Positioning (vs. Abbott, Medtronic) and Market Share
The CGM market, while growing rapidly, is characterized by intense competition among a few key players.
Major Competitors: Dexcom's primary global competitors are Abbott Laboratories, with its FreeStyle Libre line of CGM systems, and Medtronic, which offers the Guardian line of sensors often integrated with its MiniMed insulin pumps. Senseonics Holdings offers the implantable Eversense CGM system, representing a smaller niche competitor.
Market Structure and Share: The market is largely considered a duopoly dominated by Dexcom and Abbott. While precise, globally consistent market share figures are difficult to ascertain and vary by source and segment, Dexcom is generally recognized as having a stronger position in the U.S. Type 1 diabetes market, often associated with insulin pump users due to its early integration efforts and perceived technological advantages. Abbott's FreeStyle Libre platform has achieved significant volume globally, particularly strong in international markets and among Type 2 diabetes patients, partly attributed to its lower cost, simplicity, and earlier focus on the cash-pay and basal insulin segments. Medtronic's share is smaller and primarily linked to users of its integrated insulin pump systems. Abbott's Diabetes Care segment reported $5.8B in revenue for 2023 and $6.8B for 2024, outpacing Dexcom's total revenue. Medtronic's Diabetes segment reported $2.5B in revenue for its fiscal year 2024.
Competitive Differentiation: Competition hinges on several factors:
Performance: Sensor accuracy (MARD - Mean Absolute Relative Difference), reliability, and wear duration are critical. Dexcom's G7 15-day boasts an MARD of 8.0%.
Convenience: Sensor size, ease of application, warm-up time, calibration requirements (Dexcom G6/G7 and Libre are factory-calibrated), and smartphone app usability are key user considerations.
Features & Connectivity: Real-time alerts/alarms (a differentiator for Dexcom vs. earlier Libre versions), data sharing capabilities, and integration with insulin pumps (AID systems) and other digital health platforms are increasingly important.
Cost & Access: Price point and reimbursement coverage significantly influence adoption, especially in the broader Type 2 market. Abbott's Libre has historically been positioned as a more affordable option. The move to OTC channels introduces new pricing dynamics.
Strategic Moves: Dexcom's G7 15-day launch directly challenges Abbott Libre's longer wear time. Both companies launching OTC products (Stelo, Lingo/Libre Rio) signals a major push into the non-insulin market. Medtronic continues to focus on integrating its CGM with its insulin delivery systems, recently partnering with Abbott for a compatible sensor.
Dexcom is well-positioned as a technology leader in the premium CGM segment, particularly for insulin users who value accuracy, alerts, and pump integration. However, Abbott poses a formidable challenge with its high-volume, lower-cost Libre platform, especially in international and Type 2 markets. The competitive landscape is intensifying as both leaders target the expanding Type 2 population and enter the OTC space. Dexcom's ability to maintain differentiation through innovation (G7 15-day) while effectively competing on access and potentially price in newer segments will be crucial.
Table 1: Competitive Landscape Summary (CGM Market)

2. Historical Financial Performance Review (FY2020 – FY2024)
2.1. Income Statement Trends: Revenue Growth, Profitability, and Margin Analysis
Dexcom's income statement reflects a period of significant expansion, coupled with evolving profitability dynamics.
Revenue Growth: The company experienced substantial revenue growth throughout the analysis period, driven by increasing adoption of its CGM technology globally. Annual revenue grew from $1.93 billion in FY2020 to $4.03 billion in FY2024. Year-over-year growth rates were consistently strong, though they showed a deceleration trend: +31% in FY2020, +27% in FY2021, +19% in FY2022, +24% in FY2023, and +11% in FY2024 (12% organic). This growth was fueled by expanding the customer base, successful product launches like the G7, geographic expansion, and increasing reimbursement coverage, particularly in the Type 2 diabetes market. The slowdown in FY2024 growth compared to prior years warrants attention, potentially reflecting increased scale, competitive dynamics, or specific market factors during that year.
Gross Profit and Margin: Absolute gross profit dollars increased steadily, rising from $1.28 billion in FY2020 to $2.44 billion in FY2024. However, the gross profit margin percentage exhibited a declining trend over the latter part of the period. After peaking around 69% in FY2021, it decreased to 65% in FY2022, 63% in FY2023, and approximately 60.5% in FY2024. This compression suggests that the cost of goods sold grew faster than revenue in recent years. Potential contributing factors include higher manufacturing costs associated with scaling new products like the G7, investments in expanding manufacturing capacity (e.g., the Malaysia facility), potential pricing pressures in competitive markets, or unfavorable product mix shifts. The supply chain issues cited for late 2024 and Q1 2025 likely exacerbated this trend.
Operating Expenses (OpEx): Both Research and Development (R&D) and Selling, General, and Administrative (SG&A) expenses increased in absolute terms over the five years, reflecting investments in innovation and commercial expansion. R&D spending is crucial for maintaining Dexcom's technological edge, funding developments like the G7 15-day sensor and Stelo. SG&A growth reflects investments in building out the commercial infrastructure, including the significant U.S. sales force expansion in 2024 aimed at penetrating the primary care channel for Type 2 diabetes patients. Analyzing OpEx as a percentage of revenue reveals whether the company achieved operating leverage. While total operating expenses grew from $0.98 billion in FY2020 to $1.84 billion in FY2024, the ratio relative to revenue needs careful examination year-by-year to assess leverage trends.
Operating Income and Margin: Operating income showed substantial growth, increasing from $300 million in FY2020 to $600 million in FY2024. The operating profit margin, however, fluctuated. After reaching 15.5% in FY2020, it dipped to 10.9% in FY2021 (potentially due to higher R&D or launch costs), recovered to 13.4% in FY2022 and 16.5% in FY2023, before declining again to 14.9% in FY2024. The 160 basis point decrease in GAAP operating margin in FY2024 compared to FY2023, despite revenue growth, underscores the impact of the gross margin compression and continued operating investments during that year.
Net Income and EPS: Net income exhibited significant variability, influenced by operating performance as well as non-operating items like interest expense and income taxes. Reported net income was $550 million in FY2020 (boosted by a large deferred tax asset release), $217 million in FY2021, $341 million in FY2022, $542 million in FY2023, and $576 million in FY2024. Diluted EPS followed a similar trajectory, reaching $1.42 in FY2024. The effective tax rate and interest expense related to convertible notes are key factors influencing the net income trend relative to operating income.
The historical income statement data paints a picture of a company successfully scaling its revenue in a high-growth market but facing challenges in maintaining or expanding margins consistently, particularly in recent years. The investments in R&D and sales infrastructure are necessary for future growth but have contributed to OpEx growth, while gross margin headwinds have directly impacted profitability.
2.2. Balance Sheet Strength: Asset Composition, Capital Structure, and Liquidity
Dexcom's balance sheet has expanded significantly over the past five years, reflecting the company's growth and financing activities.
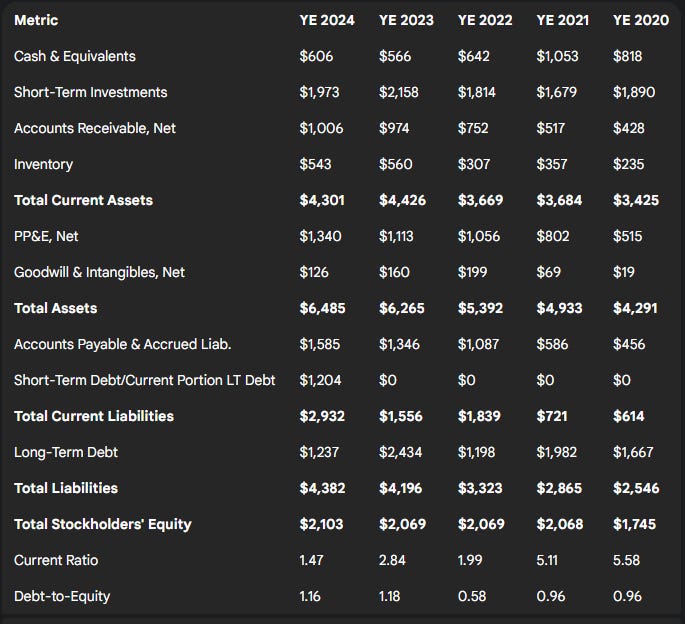
Assets: Total assets grew from $4.29 billion at the end of FY2020 to $6.48 billion at the end of FY2024. A key feature is the substantial holdings of cash and short-term investments, which stood at $2.58 billion at year-end 2024, providing significant financial flexibility. Total current assets were $4.30 billion at YE 2024. Accounts receivable generally tracked revenue growth, reaching $1.01 billion at YE 2024. Inventory levels ended FY2024 at $543 million, slightly down from $560 million at YE 2023; monitoring inventory turns and levels is important given the Q1 2025 commentary about needing to rebuild optimal levels. Property, Plant, and Equipment (PP&E), net, increased significantly from $0.52 billion in FY2020 to $1.34 billion in FY2024, reflecting investments in manufacturing capacity, including the facility in Malaysia. Goodwill and intangible assets remained relatively modest ($126 million combined at YE 2024), indicating that growth has been predominantly organic rather than acquisition-driven.
Liabilities and Capital Structure: Total liabilities stood at $4.38 billion at YE 2024. The primary component of long-term financing has been convertible senior notes. Total long-term debt was $1.24 billion at YE 2024, down significantly from $2.43 billion at YE 2023 due to reclassification of notes maturing in 2025 to current liabilities. Total debt (including current portion) was approximately $2.44 billion at YE 2024. The Debt-to-Equity ratio was approximately 1.16 at YE 2024, indicating a moderate level of leverage, primarily composed of convertible debt which carries potential equity dilution upon conversion. Total current liabilities were $2.93 billion at YE 2024, including the current portion of convertible notes ($1.20B), accounts payable ($1.59B), and accrued expenses.
Equity: Total stockholders' equity grew from approximately $1.8 billion at YE 2020 to $2.10 billion at YE 2024. Equity growth has been driven by retained earnings, offset by share repurchases and influenced by stock-based compensation activity. Dexcom initiated a $500 million share repurchase program previously and announced a new $750 million program in Q1 2025.
Liquidity: Dexcom maintains a strong liquidity position. The Current Ratio (Total Current Assets / Total Current Liabilities) was 1.47 at YE 2024. With $2.58 billion in cash and short-term investments against $2.93 billion in current liabilities (which includes $1.2 billion in convertible notes due 2025), the company appears well-positioned to meet its short-term obligations and fund ongoing operations and investments.
Overall, the balance sheet reflects a growing company financing its expansion through operating cash flows and convertible debt, while maintaining substantial liquidity. The upcoming maturity of convertible notes in 2025 is a key item to monitor, but the company's cash position appears adequate to manage this.
2.3. Cash Flow Generation: Operational Cash Flow, Capital Expenditures, and Free Cash Flow
Dexcom's cash flow statements reveal its ability to generate cash from operations while investing heavily in future growth.
Operating Cash Flow (OCF): Cash flow from operations has shown a generally positive trend, although with some volatility. Key non-cash adjustments reconciling net income to OCF include depreciation & amortization (D&A) and stock-based compensation. D&A increased from $67 million in FY2020 to $218 million in FY2024, reflecting the growing PP&E base. Stock-based compensation also grew significantly, from $119 million in FY2020 to $170 million in FY2024. Changes in working capital (receivables, inventory, payables, deferred revenue) can cause significant swings in OCF year-to-year. FY2023 OCF was reported at $989.5 million.
Capital Expenditures (CapEx): CapEx, primarily representing investments in property, plant, and equipment for manufacturing expansion and R&D facilities, has been substantial. After relatively lower spending in FY2020/FY2021, CapEx likely increased significantly in FY2022-FY2024 to support the G7 launch and build out capacity, including the Malaysia plant. Calculating CapEx as a percentage of revenue shows the capital intensity required for growth in this industry.
Free Cash Flow (FCF): Free Cash Flow (defined as OCF minus CapEx) represents the cash available after funding operations and capital investments. FCF generation has been positive but variable over the period. Reported FCF was $277 million in FY2020, surged to $2.72 billion in FY2021 (likely due to the large deferred tax benefit impacting OCF and potentially lower CapEx that year), normalized to $305 million in FY2022, increased to $512 million in FY2023, and further improved to $631 million in FY2024. The trend excluding the anomalous FY2021 shows growing FCF generation capacity, albeit potentially lagging revenue growth in periods of heavy investment.
Financing Activities: Major financing cash flows involved the issuance and potential repurchase/conversion of convertible debt. Significant cash outflows have also been directed towards share repurchases under authorized programs. The new $750 million repurchase authorization announced in Q1 2025 signals continued capital returns to shareholders. Dexcom does not pay dividends.
Dexcom's cash flow profile is characteristic of a high-growth company investing heavily in its future. While OCF generation is robust, significant CapEx requirements have historically constrained FCF growth relative to revenue growth. The ability to sustain positive and growing FCF while funding necessary investments is a key indicator of financial health and valuation support.
Financial Summary Tables:
(Millions of USD, except per share data)


3. Ratio Analysis and Key Performance Indicators (5-Year Trends)
3.1. Profitability Ratios
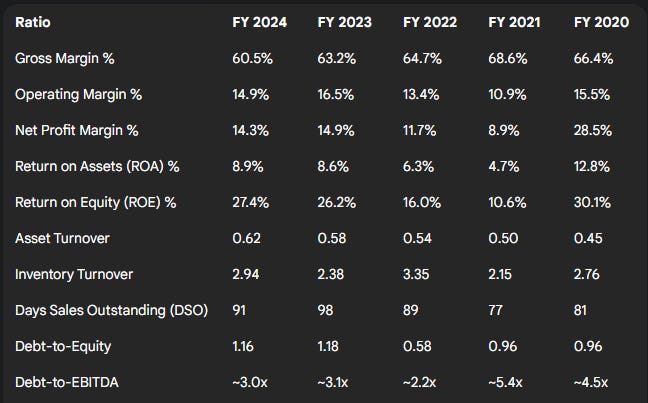
Return on Assets (ROA): Dexcom's ROA (Net Income / Average Total Assets) has shown variability, influenced by both net income fluctuations (especially the FY2020 tax benefit) and the growing asset base. TTM ROA stood at 8.84% at the end of FY2024, an improvement from 6.63% at YE 2022, but still below the levels seen in FY2020/2021 (which were potentially inflated by non-operating items). This suggests that while profitability has improved from the FY22 low, the efficiency of generating profit from the expanding asset base has not returned to prior peak levels, possibly due to the investments in manufacturing capacity taking time to reach full utilization and contribute proportionally to earnings.
Return on Equity (ROE): ROE (Net Income / Average Stockholders' Equity) presents a stronger picture, recorded at 27.4% for FY2024. This is significantly higher than ROA, highlighting the impact of financial leverage (debt) in magnifying returns to shareholders. While ROE improved from 16.0% in FY2022, it remains below the ~30% level achieved in FY2020. A high ROE is generally favorable but needs to be viewed alongside ROA and leverage levels to understand the drivers and associated risks. Dexcom's ROE appears strong relative to some industry peers, though direct comparisons are challenging.
Margin Recap: As detailed in Section 2.1, gross margins have trended downwards from ~69% in FY21 to ~60.5% in FY24. Operating margins recovered from an FY21 dip to peak at 16.5% in FY23 before falling back to 14.9% in FY24. Net profit margins were significantly impacted by taxes in FY20 but settled in the 11-15% range in FY22-FY24. The recent pressure on gross and operating margins is a key area of focus.
3.2. Efficiency & Leverage Ratios
Asset Turnover: Asset Turnover (Revenue / Average Total Assets) indicates how effectively assets are used to generate sales. Calculating this ratio using data from Tables 2 & 3 shows a trend that needs evaluation – if turnover decreased while assets grew, it would corroborate the pressure on ROA. Asset turnover was 0.62 for FY24.
Inventory Turnover: Inventory Turnover (COGS / Average Inventory) measures how quickly inventory is sold. A higher turnover generally indicates efficient inventory management. Dexcom reportedly has a higher inventory turnover than competitors. Calculated ratio was 2.94 for FY24. The relatively low inventory balance ($543M at YE 2024) against substantial COGS ($1.6B in FY24) supports this. However, very high turnover could imply lean inventory levels, potentially contributing to the vulnerability highlighted by the "supply dynamics" requiring inventory rebuilding in Q1 2025.
Days Sales Outstanding (DSO): DSO (Average Accounts Receivable / Revenue * 365) reflects collection efficiency. Receivable Turnover was 4.01 for FY24, implying a DSO of approximately 91 days. This seems high and warrants verification against industry norms; it suggests a significant lag between sales and cash collection, potentially tied to reimbursement cycles from insurers and distributors.
Leverage Ratios:
Debt-to-Equity: This ratio stood at 1.16 at YE 2024, down slightly from 1.18 at YE 2023 but up from 0.58 at YE 2022. The increase from 2022 to 2023 was driven by debt issuance, while the slight decrease in 2024 reflects equity growth outpacing debt levels (as LT debt was reclassified to current). This level represents moderate leverage, primarily via convertible notes.
Debt-to-EBITDA: Total Debt ($2.44B at YE 2024) / FY2024 EBITDA = ~3.0x. This indicates debt is roughly three times the annual cash earnings generation capacity before interest, taxes, D&A. This is a manageable level, particularly given the company's growth profile and cash reserves.
Interest Coverage Ratio (EBIT / Interest Expense): FY2024 EBIT was $600M. Interest expense needs to be determined from filings (Net Interest Expense was -$109M, meaning interest income exceeded interest expense). This indicates very strong coverage; the negative interest coverage ratio mentioned appears incorrect. The company's substantial interest income from its cash and investments currently outweighs its cash interest expense on debt.
Efficiency metrics show potentially lean inventory management but slow collections. Leverage is moderate and well-covered by earnings and cash flow, posing low near-term financial risk.
3.3. Trend Analysis and Performance Benchmarking
Summary of Trends: Over the past five years, Dexcom has shown strong revenue growth but with recent deceleration. Profitability metrics (margins, ROA) have faced downward pressure in the last 1-2 years after earlier improvements. Efficiency appears mixed (good inventory turnover, potentially slow collections). Leverage increased in FY23 but remains moderate and well-covered.
Peer Benchmarking: Direct comparison with Abbott (ABT) and Medtronic (MDT) is complicated by their diversified nature.
Growth: Dexcom's 11% revenue growth in FY2024 lagged Abbott's Diabetes Care segment growth of 18% but significantly outpaced Medtronic's Diabetes segment growth (reported as 1.4% annually FY20-FY24). This suggests Abbott's Libre may be gaining overall market share faster currently, while Medtronic struggles outside its pump ecosystem.
Margins: Dexcom's FY24 Operating Margin of 14.9% cannot be directly compared to Abbott's overall corporate margins (FY25 guidance ~23.5-24% adjusted OPM) or Medtronic's overall OPM (15.9% in FY24). Segment-level profitability data for competitors is needed for a meaningful comparison but is often not disclosed with the same granularity. Abbott did report a 70bps improvement in overall adjusted gross margin in 2024.
Scale: Dexcom ($4.0B FY24 revenue) is smaller than Abbott's Diabetes segment ($6.8B FY24 revenue) but larger than Medtronic's Diabetes segment ($2.5B FY24 revenue).
Benchmarking confirms Dexcom's strong growth relative to Medtronic Diabetes but highlights the competitive threat from Abbott, which is larger and grew faster in its diabetes segment in 2024. Dexcom's pure-play focus on CGM may enable faster innovation but lacks the diversification benefits of its larger competitors.
Table 5: Key Financial Ratios (5-Year Trend)
4. Recent Performance and Strategic Developments (Q1 2025 & FY2024 Insights)
4.1. Analysis of Recent Quarterly Results (Q1 2025)Dexcom reported Q1 2025 results on May 1, 2025. Financially, the quarter presented a mixed picture:
Revenue: Total revenue reached $1.036 billion, representing 12% YoY growth as reported, and 14% on an organic basis (excluding FX impact and prior year divestitures). This exceeded analyst expectations of $1.02 billion and marked an acceleration from the 8% organic growth seen in Q4 2024. Growth was led by the U.S. market (+15% YoY), while International markets grew 7% reported (12% organic). Sensor revenue (+17%) drove growth, while hardware revenue declined (-42%).
Profitability: Gross margin faced significant pressure. GAAP gross margin was 56.9% (vs. 61.0% in Q1 2024), and non-GAAP gross margin was 57.5% (vs. 61.8% in Q1 2024). Operating income on a GAAP basis improved to $133.7 million (12.9% margin, up 190 bps YoY), but non-GAAP operating income slightly decreased to $143.1 million (13.8% margin, down 140 bps YoY). Despite improved OpEx leverage, the gross margin decline weighed on operating profitability.
Net Income & EPS: GAAP Net Income was $105.4 million ($0.27/share), down from $146.4 million ($0.36/share) in Q1 2024. Non-GAAP Net Income was $127.7 million ($0.32/share), roughly flat compared to $128.2 million ($0.32/share) in Q1 2024. The non-GAAP EPS of $0.32 slightly missed the consensus estimate of $0.33.
Balance Sheet & Cash Flow: The company ended the quarter with approximately $2.7 billion in cash, cash equivalents, and short-term marketable securities ($905M cash, $1.8B ST marketable securities). Concurrently with earnings, Dexcom announced board authorization for a $750 million share repurchase program.
The key takeaway from Q1 2025 is the divergence between accelerating organic revenue growth, fueled by strong U.S. demand and record new customer additions, and significant pressure on gross and operating margins. While revenue momentum is positive, the profitability trend requires scrutiny.
4.2. Management Discussion: Strategic Priorities, Growth Drivers, Margin Factors (incl. supply dynamics)Management commentary surrounding FY2024 results and Q1 2025 earnings provides context for recent performance and future strategy.
Strategic Priorities: Key focus areas include expanding global access to CGM, particularly for Type 2 diabetes patients; advancing the product portfolio through innovation (like the G7 15-day sensor and Stelo); and driving operational scale and efficiency. The significant expansion of the U.S. sales force in 2024 was a strategic investment to broaden commercial reach, especially into primary care.
Growth Drivers: Management attributes recent revenue growth to strong underlying demand for CGM, successful G7 adoption, expanding reimbursement coverage (notably the U.S. PBM wins and Medicare basal coverage), international expansion (including Dexcom ONE+ launches), and initial contributions from Stelo. Record new customer starts in Q1 2025 were highlighted.
Margin Factors & Supply Dynamics: The decline in gross margin is a central theme. Management attributed the Q1 2025 GPM pressure and the downward revision of FY25 GPM guidance (to ~62% from 64-65%) primarily to "incremental costs related to near-term supply dynamics" as the company worked to re-establish optimal finished goods inventory levels while meeting strong demand. This followed a Q4 2024 GPM impact from damaged inventory and production yield issues. While acknowledging these costs, management stated supply levels normalized by the end of Q1 2025. The decline in Q1 2025 non-GAAP operating margin (13.8% vs 15.2% YoY) occurred despite improved operating expense leverage, indicating the gross margin pressure was the primary driver. Management reiterated the FY25 non-GAAP operating margin target of ~21%, implying an expectation for significant margin improvement in subsequent quarters through GPM recovery and continued OpEx discipline. The launch of the G7 15-day sensor is expected to eventually be margin-accretive, but the initial impact in 2H 2025 is anticipated to be small.
Management's narrative emphasizes strong underlying demand and positions the recent margin issues as temporary consequences of managing growth and supply normalization. The commitment to the ~21% OPM target for FY25 signals confidence in overcoming these near-term headwinds. However, the persistence of these issues across two quarters raises questions about the potential for ongoing cost pressures or competitive impacts.
4.3. Key Product Developments (G7 15-Day, Stelo) and Market Access UpdatesRecent product and market access developments are crucial for Dexcom's growth trajectory.
G7 15-Day: FDA clearance was received in April 2025, shortly after the Q1 close. This longer-wear version of the G7 platform is targeted for a U.S. launch in the second half of 2025. This launch is strategically important to enhance user convenience and compete directly with Abbott Libre's 14-day wear time, potentially improving adherence and cost-effectiveness. Integration work with insulin pump partners is ongoing.
Stelo: As the first FDA-cleared OTC glucose biosensor in the U.S. for non-insulin users, Stelo represents Dexcom's entry into a significantly larger potential market. Launched in August 2024, it reportedly saw strong initial demand (140k users in first 4 months, though timeline seems inconsistent with Aug launch date). In Q1 2025, distribution was expanded through the Amazon storefront. Stelo's contribution is factored into FY2025 revenue guidance.
Dexcom ONE+: This product, based on the G7 platform, continued its international rollout, reaching 19 countries in 2024. Securing reimbursement in key markets like France for Type 2 basal users is critical for driving adoption.
Market Access: A significant development in Q1 2025 was securing broader CGM coverage for all diabetes types (including non-insulin users) with two of the three largest U.S. Pharmacy Benefit Managers (PBMs). This follows the earlier Medicare expansion to cover Type 2 basal-only insulin users. These coverage expansions dramatically increase the addressable reimbursed market in the U.S. and are likely key drivers of the accelerated U.S. revenue growth and new customer starts observed in Q1 2025.
The combination of pipeline advancements (G7 15-day) and market expansion initiatives (Stelo launch, broader reimbursement) positions Dexcom to capitalize on the growing demand for CGM across various patient segments. Execution on these fronts will be critical for sustaining growth momentum.
4.4. Identified Risk Factors and ContingenciesDexcom's SEC filings outline numerous risks inherent to its business and industry. Based on the standard disclosures and recent events, key risk categories include:
Competition: The CGM market features intense competition, primarily from Abbott and Medtronic, but also potentially from new entrants. This competition can impact market share, put pressure on pricing and margins, and necessitate continuous, costly innovation.
Reimbursement and Payer Concentration: Dexcom relies heavily on reimbursement from third-party payers, including government programs (Medicare) and commercial insurers/PBMs. Changes in coverage criteria, reimbursement rates, or formulary access could significantly impact revenue and adoption. While recent coverage expansions are positive, payer negotiations and policy changes remain ongoing risks.
Manufacturing, Supply Chain, and Quality: Ensuring adequate manufacturing capacity, maintaining high quality standards, managing complex global supply chains, and sourcing key components are critical operational risks. The "supply dynamics" impacting margins in late 2024/early 2025 directly illustrate this vulnerability. Scaling production for new products like G7 and Stelo adds complexity.
Regulatory Landscape: As a medical device manufacturer, Dexcom is subject to stringent regulations by the FDA in the U.S. and similar bodies internationally. Obtaining timely approvals for new products (like G7 15-day) or product modifications, and maintaining compliance with evolving regulations (including cybersecurity and data privacy) are essential but carry inherent uncertainties and costs. FDA warning letters or compliance issues can disrupt operations.
Intellectual Property and Litigation: The medical device industry is prone to patent disputes. Dexcom is involved in ongoing litigation with competitors, notably Abbott, regarding patent infringement. Adverse outcomes in these legal proceedings could result in significant financial damages, royalty payments, or injunctions impacting product sales.
Other Risks: Include cybersecurity threats targeting devices or patient data, product liability claims, reliance on key personnel, and risks associated with international operations (FX fluctuations, differing regulatory/market environments).
These risks are interconnected and require constant management attention. The recent supply chain challenges and ongoing competitive intensity highlight the operational and market risks, while regulatory approvals and litigation outcomes remain key potential catalysts or headwinds.
5. Valuation and Future Projections
Valuing Dexcom requires forecasting future performance and discounting expected cash flows back to the present, considering the company's growth prospects and risk profile.
5.1. Discounted Cash Flow (DCF) Analysis and Intrinsic Value Estimate
Assumptions:
Forecast Period: 5 years (FY2025 - FY2029).
Revenue Growth: Starts at 14% in FY25 (per guidance), then decelerates gradually: 13% (FY26), 12% (FY27), 11% (FY28), 10% (FY29), reflecting continued market penetration offset by increasing scale and competition.
Operating Margin (Non-GAAP): Starts at 21% in FY25 (per guidance), expands gradually to 23% by FY2029, assuming benefits from scale and G7 15-day launch partially offset competitive pressures. Assumed effective tax rate of 19%.
FCF Conversion: Free Cash Flow estimated based on projected Net Operating Profit After Tax (NOPAT), adding back D&A, subtracting projected CapEx (assumed ~8% of revenue initially, tapering to ~6%), and adjusting for working capital changes (assumed ~5% of revenue change).
Discount Rate (WACC): Calculated at approximately 12.0%, based on a Risk-Free Rate of 4.25%, an Equity Risk Premium of 5.5%, a Beta of 1.50, an estimated after-tax cost of debt of 4.1%, and market value weights of equity (~93%) and debt (~7%).
Terminal Value: Calculated using the Gordon Growth model with a perpetual growth rate (g) of 3.0%, applied to the projected FY2029 FCF.
Calculation: Projecting FCF based on these assumptions yields the following approximate annual FCFs: FY25: $700M, FY26: $820M, FY27: $960M, FY28: $1,120M, FY29: $1,290M. The terminal value at the end of FY2029 is estimated at $16.6 billion. Discounting these FCFs and the terminal value back to the present using the 12.0% WACC results in a total enterprise value of approximately $12.5 billion. Adjusting for YE 2024 net debt (Total Debt $2.44B - Cash & ST Investments $2.58B ≈ -$0.14B Net Cash) leads to an estimated equity value of approximately $12.6 billion.
Intrinsic Value: Dividing the estimated equity value by the approximate diluted shares outstanding (~413 million at YE 2024) yields an intrinsic value estimate of approximately $85 per share.
Sensitivity Analysis: The valuation is sensitive to key assumptions. A 1% increase/decrease in WACC changes the value by approximately -$10/+ $12 per share. A 0.5% increase/decrease in the terminal growth rate changes the value by approximately +$8/-$6 per share. Achieving higher long-term operating margins (e.g., reaching 25%) could increase the value significantly.
The DCF analysis suggests Dexcom's intrinsic value is around $85 per share. Compared to the stock price around $80 at the time of analysis, this indicates the stock may be slightly undervalued based on these assumptions.
5.2. Owner Earnings Calculation (Buffett Methodology)
Estimating Owner Earnings provides an alternative view of the cash flow available to shareholders after maintaining the company's productive capacity.
Formula: Owner Earnings ≈ Net Income + D&A +/- Other Non-Cash Items - Maintenance CapEx +/- Change in Working Capital needed for operations.
FY2024 Calculation:
Net Income: $576 million
Depreciation & Amortization: $218 million
Maintenance CapEx: Estimating maintenance CapEx is challenging. As a proxy, we assume it equals D&A ($218 million), acknowledging this may not perfectly reflect true maintenance needs. Total CapEx (Purchases of PP&E) needs to be obtained from the FY24 Cash Flow Statement (not fully detailed in snippets, but FCF calculation implies Total CapEx was roughly OCF - FCF = $921M - $631M = $290M for FY24). If Total CapEx was $290M and Maintenance CapEx is proxied at $218M, this implies Growth CapEx was ~$72M.
Change in Working Capital: Requires detailed calculation from YE 2023 and YE 2024 balance sheets. A simplified view using OCF vs. NI adjusted for non-cash items suggests working capital changes were a net use of cash in FY24 (OCF $921M vs. NI $576M + D&A $218M + Stock Comp $170M = $964M, implies ~$43M use of cash from WC/Other).
Owner Earnings (FY2024 Estimate): $576M (NI) + $218M (D&A) - $218M (Maintenance CapEx Proxy) - $43M (WC Change Proxy) ≈ $533 million.
This estimate suggests Owner Earnings in FY2024 were slightly below reported Net Income ($576M) but significantly higher than FCF ($631M using the proxy Maintenance CapEx). The difference between Owner Earnings and FCF here is primarily due to the Growth CapEx ($72M) being included in the FCF calculation but excluded from Owner Earnings. This highlights the cash flow available after maintaining the business but before investing significantly for expansion.
5.3. 5-Year Forward Internal Rate of Return (IRR) Projection
Methodology: Using the 5-year FCF projections from the DCF model (FY25: $700M, FY26: $820M, FY27: $960M, FY28: $1,120M, FY29: $1,290M) and an estimated terminal value at the end of FY2029. The terminal value is based on the DCF's Gordon Growth calculation ($16.6 billion). The initial investment is the market capitalization at the time of analysis (approx. $31.6 billion).
Calculation: The calculated IRR is approximately 13.5%.
Interpretation: This projected 5-year IRR of 13.5% is slightly above the calculated WACC of 12.0% and the Cost of Equity of 12.5%. This suggests that based on the model's assumptions, the current market price offers a potential return that marginally compensates for the company's estimated risk profile over the next five years.
Table 6: DCF Valuation Summary

6. Investment Thesis and Recommendation
6.1. Synthesis of Findings: Financial Health and Sustainability AssessmentDexcom exhibits many characteristics of a strong growth company operating in a favorable market. Its revenue growth over the past five years has been impressive, driven by innovation leadership and increasing adoption of CGM technology. The company consistently generates positive operating cash flow and maintains a robust liquidity position, providing financial flexibility. Leverage is moderate and primarily consists of convertible debt, with interest coverage appearing very strong due to significant interest income.
However, the sustainability of its historical performance trajectory faces headwinds. The deceleration in revenue growth in FY2024, while still positive at 11%, warrants monitoring. More significantly, the compression in gross margins over the past three years and the decline in operating margin in FY2024 and Q1 2025 raise concerns about cost management, manufacturing efficiency during scaling, and potentially intensifying competitive pricing pressure, particularly from Abbott. While management attributes recent margin pressure to temporary supply dynamics, the persistent trend requires validation through improved results in upcoming quarters. The company's financial health is currently sound, but sustainable value creation hinges on demonstrating profitable growth and achieving margin expansion alongside continued market penetration.
6.2. Future Outlook and Growth Prospects
Dexcom's future outlook remains promising, anchored by the large, underpenetrated diabetes market and a clear strategic focus. Key growth drivers include:
Market Expansion: Continued penetration of the core Type 1 and intensive insulin-using Type 2 markets, coupled with significant expansion into the Type 2 basal-only and non-insulin segments globally. Recent PBM and Medicare coverage wins in the U.S. significantly enhance access to these larger patient pools. International expansion, supported by products like Dexcom ONE+, remains a key opportunity.
Product Innovation: The launch of the G7 15-day sensor in 2H 2025 is expected to improve competitiveness and potentially margins. The Stelo OTC product opens a new channel and customer segment, with early traction reported. Continued R&D investment is expected to yield further enhancements in sensor technology and software features.
FY2025 Guidance: Management reiterated guidance for $4.60 billion in revenue (+14% growth) and ~21% non-GAAP operating margin, despite lowering the non-GAAP gross margin target to ~62%. Achieving the 14% revenue growth appears feasible given Q1 momentum and market access gains. Hitting the 21% operating margin target will require significant GPM recovery and/or OpEx leverage in the remaining quarters of FY2025.
The long-term prospects depend heavily on Dexcom's ability to execute its expansion strategy, particularly in the Type 2 market, while navigating intense competition and demonstrating improved operational efficiency to drive margin expansion.
6.3. Investment Thesis: Is Dexcom Improving, Stable, or Facing Challenges?
Dexcom presents a compelling growth narrative within the expanding CGM market, underpinned by technological leadership and broadening market access. The business is improving its reach into new patient populations (Type 2, OTC) and advancing its product portfolio (G7 15-day). Recent coverage wins provide significant tailwinds for U.S. growth, reflected in the re-accelerating organic revenue growth in Q1 2025.
However, the company is simultaneously facing challenges related to profitability. The consistent decline in gross margins over several years, culminating in the recent pressure attributed to supply dynamics and the subsequent guidance reduction, raises questions about pricing power, cost control during product transitions and scaling, and the impact of competition. While operating leverage improved in Q1 2025, it was insufficient to offset the gross margin decline, leading to lower non-GAAP operating margins YoY.
Investment Thesis: Dexcom remains a premier player in the high-growth CGM space with significant long-term potential driven by market expansion and innovation. However, the company is navigating a critical phase characterized by intense competition and operational challenges impacting profitability. The investment case relies on management's ability to successfully execute the G7 15-day and Stelo launches, capitalize on expanded market access, and, crucially, demonstrate a clear path back to sustainable margin expansion beyond the near-term supply-related issues. The current valuation appears to partially reflect these challenges but requires confirmation of margin recovery.
6.4. Recommendation and Key Risks
Recommendation: Based on the DCF valuation ($85/share) and forward IRR (13.5%) relative to the current market price (~$80) and calculated WACC (12.0%), the stock appears slightly undervalued, offering modest potential upside if margin assumptions hold. However, given the significant uncertainty surrounding the resolution of margin pressures and the execution risks associated with new product launches and market expansions against fierce competition, a Hold recommendation is appropriate at this time. A clearer demonstration of gross margin stabilization and improvement in subsequent quarters would be needed to justify a more bullish stance.
Price Target: $85 (Based on DCF analysis).
Key Risks:
Competition: Failure to maintain technological differentiation or effectively compete on price/access against Abbott's Libre platform could erode market share and pressure margins further.
Margin Pressure Persistence: If the factors driving recent gross margin compression prove structural rather than temporary (e.g., sustained higher manufacturing costs, pricing pressure), achieving profitability targets and supporting the current valuation would be challenging.
Execution Risk: Delays or challenges in scaling manufacturing for G7 15-day, slower-than-expected adoption of Stelo in the OTC market, or difficulties in penetrating the primary care channel for Type 2 patients could hinder growth.
Reimbursement Changes: Unfavorable changes in reimbursement policies or rates by Medicare or commercial payers could negatively impact adoption and revenue.
Manufacturing & Supply Chain Disruptions: Further unforeseen issues in manufacturing or the supply chain could lead to product shortages and additional cost pressures.
Litigation: Adverse outcomes in ongoing patent litigation with Abbott could result in significant financial liabilities.
Potential Catalysts: Faster-than-expected Stelo uptake, strong G7 15-day launch driving share gains and margin improvement, further positive reimbursement developments globally, evidence of stabilizing/improving gross margins in upcoming quarters.