


Ferrovial: Building Blocks for a Strong Portfolio?
Held - fairly valued.

I. Executive Summary
Ferrovial has undergone a significant strategic transformation, pivoting towards high-value transportation infrastructure in North America, complemented by an emerging Energy division, while divesting non-core or mature assets like its Services business and a majority of its Heathrow stake. This asset rotation has significantly impacted recent financial results, notably boosting reported net profit in 2024 through divestment gains.
Financially, Ferrovial exhibits robust health at the corporate level, characterized by a consistent net cash position (excluding non-recourse infrastructure project debt) and an investment-grade credit rating. Underlying operational profitability, measured by Adjusted EBITDA, shows a strong recovery and growth trend post-pandemic. Liquidity remains strong. However, consolidated leverage metrics include substantial non-recourse project debt, and free cash flow generation has been volatile due to large, lumpy investments in growth projects.
Operationally, the core Toll Roads segment, particularly the US Managed Lanes, demonstrates exceptional performance with revenue per transaction outpacing inflation. The Construction segment has shown improved profitability, meeting or exceeding margin targets in 2024 after previous challenges. The successful execution of major projects, such as the on-schedule New Terminal One at JFK, is crucial.
Growth prospects are centered on the continued ramp-up and expansion of North American infrastructure assets (Managed Lanes, JFK Airport) and the development of the Energy division. The substantial construction order book provides near-term visibility. The key challenge lies in successfully executing these large projects and ensuring that new investments generate returns sufficient to justify the capital deployed and replace earnings from divested assets.
The investment thesis hinges on Ferrovial's successful transformation into a focused operator of high-value, strategically located infrastructure assets, primarily in North America. While recent reported earnings are inflated by divestments, the underlying operational performance is improving, and the strategic direction appears sound, capitalizing on favorable trends in transportation and energy transition. The intrinsic value is estimated at $49.85 per share using a Discounted Cash Flow model, suggesting the stock is currently trading near its fair value. The projected 5-year IRR is approximately 8.5%. Key risks include execution challenges on major projects, reliance on continued successful asset rotation, potential construction cost overruns, and sensitivity to interest rate fluctuations and regulatory changes. Overall, Ferrovial presents a stable outlook with moderate growth potential, contingent on successful execution of its strategic plan.
II. Get Oriented
A. Business & Industry Overview
Business Model:
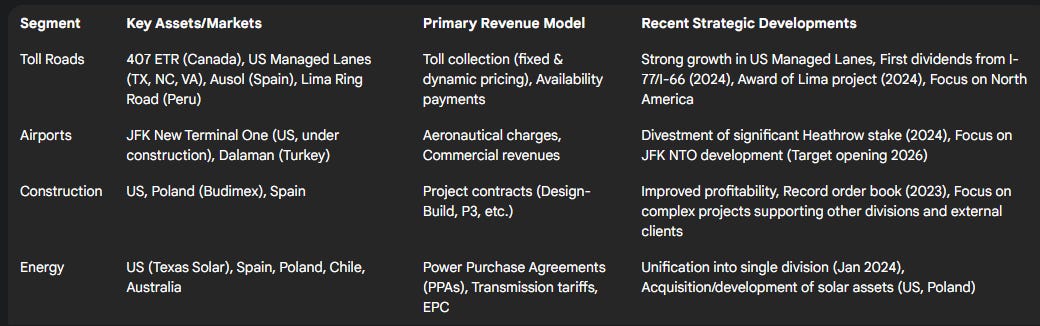
Ferrovial SE operates as a global developer and operator of sustainable infrastructure, employing an integrated business model that spans the entire project lifecycle. This includes conceptualization, design, financing, construction, and operation of critical infrastructure assets. The company is structured around four primary business units as of 2024: Toll Roads (managed under the Cintra brand), Airports, Construction, and Energy. A key element of this model is the strategic role of the Construction division, which provides essential engineering and building capabilities to support the development phases of the company's concession businesses (Toll Roads and Airports), in addition to undertaking projects for external clients. This integration aims to capture value across the infrastructure value chain.
Primary Revenue Sources:
Revenue generation is diversified across its segments:
Toll Roads: Primarily toll collections from its network of highways and managed lanes, with a significant concentration in the United States and Canada. Advanced traffic management and dynamic pricing strategies are employed, particularly in the US Managed Lanes.
Airports: Revenue streams include aeronautical charges (landing fees, passenger fees), commercial activities (retail, parking), and other services related to airport operations. Key assets driving this segment are currently the investment in New Terminal One (NTO) at JFK International Airport and Dalaman Airport in Turkey.
Construction: Income is derived from contracts for large-scale public and private infrastructure projects, including highways, bridges, tunnels, airports, buildings (including data centers), and water treatment facilities.
Energy: This newer segment generates revenue through the development, construction, and operation of renewable energy assets (primarily solar PV), electricity transmission lines, and energy efficiency solutions.
Key Operational Segments:
Toll Roads (Cintra): This segment focuses on developing and operating high-value concessions in developed markets, with a strategic emphasis on North America to address urban congestion. Flagship assets include the 407 ETR electronic toll road in Toronto, Canada, and a portfolio of Managed Lanes in the US, notably the North Tarrant Express (NTE), LBJ Express, and NTE 35W in Dallas-Fort Worth, Texas, the I-77 Express Lanes in Charlotte, North Carolina, and the I-66 Express Lanes outside Washington D.C.. A new 30-year concession for the Anillo Vial Periférico Project in Lima, Peru was awarded in 2024.
Airports: Ferrovial holds significant investments in airport infrastructure. Its primary current investment is the development of the New Terminal One (NTO) at JFK International Airport in New York. It also operates Dalaman International Airport in Turkey. Historically, Ferrovial held a major stake in London Heathrow Airport (HAH) and managed the AGS airports (Aberdeen, Glasgow, Southampton) in the UK, but significantly reduced its Heathrow stake in 2024 and previously divested other airport assets.
Construction: This division operates globally, with major activities concentrated in the United States, Poland (through its listed subsidiary Budimex S.A.), and Spain. It specializes in executing complex civil engineering and building projects, often supporting the Toll Road and Airport segments' development needs.
Energy: Established in October 2021 and further consolidated in January 2024, this division focuses on renewable energy generation (solar PV), electricity transmission infrastructure, and energy solutions, primarily targeting markets like the United States, Spain, Poland, Chile, and Australia.
Industry Trends:
Ferrovial operates within an environment shaped by several key trends:
Sustainable Infrastructure: Growing global demand for infrastructure development that incorporates environmental sustainability and contributes to decarbonization goals.
Energy Transition: Significant investment flowing into renewable energy generation, energy storage, and grid modernization to support the shift away from fossil fuels.
Digitalization: Increasing adoption of technology for optimizing infrastructure design, construction, operations, and asset management (e.g., smart highways, digital twins).
Urbanization & Mobility: Continued growth of cities necessitates innovative solutions for managing congestion and improving transportation efficiency, fueling demand for projects like Managed Lanes.
Public-Private Partnerships (P3): Continued use of P3 models by governments to finance and deliver large infrastructure projects, particularly in North America. US initiatives like the Infrastructure Investment & Jobs Act provide a supportive backdrop.
Competitive Landscape:
The infrastructure sector is highly competitive across all of Ferrovial's operating segments.
Toll Roads: Competes with established international operators like Abertis and other developers vying for concession contracts.
Airports: Faces competition from global airport operators and infrastructure funds seeking investments in airport assets.
Construction: Competes against a wide range of large multinational construction firms (e.g., Acciona, Skanska, OHLA) and numerous regional/local players in its key markets.
Energy: Enters a competitive field populated by established utility companies, independent power producers, and specialized renewable energy developers.
Ferrovial leverages its extensive experience, integrated model, engineering capabilities (via the Construction division), and track record in managing complex P3 projects as key differentiators. Its recent triple listing (Spain, Netherlands, US) aims to enhance visibility and access to global capital markets.
The company's strategic direction appears to be shifting from a broadly diversified construction and concession company towards a more focused operator of high-value transportation assets, primarily in stable, developed markets like North America. This is complemented by a strategic entry into the high-growth, albeit competitive, renewable energy sector. This evolution aims to capture higher returns and align with key industry trends like decarbonization and advanced mobility solutions. The integrated model, while a potential strength in delivering complex projects, also necessitates careful management of inter-segment risks, as demonstrated by past challenges in the Construction division. The success of this refined strategy hinges on disciplined capital allocation and effective execution of its significant project pipeline.
Table: Ferrovial Segment Overview (2024 Focus)
B. Context Setting
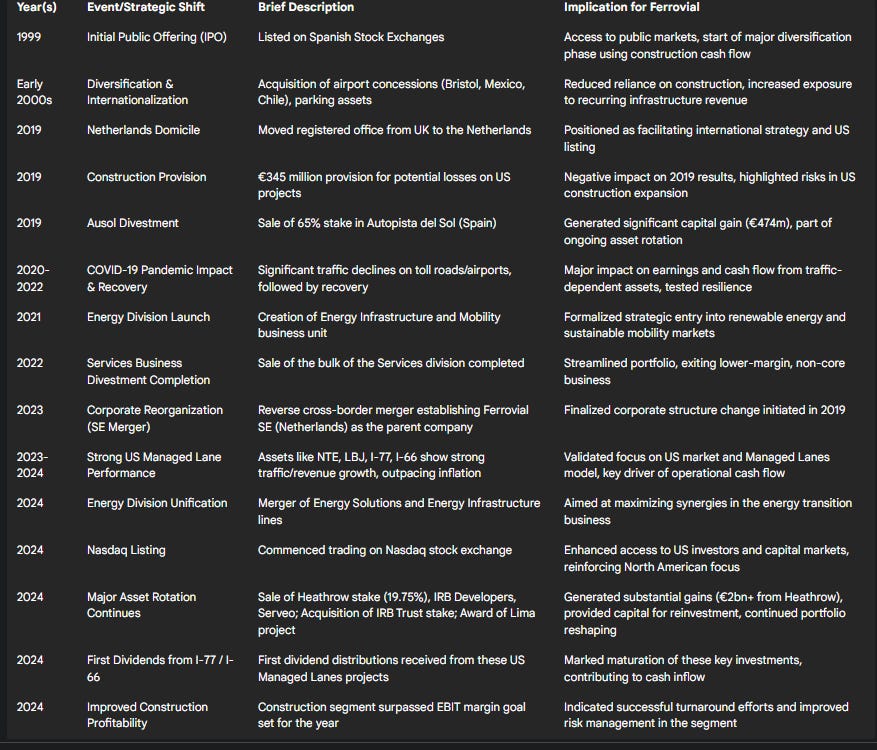
Ferrovial's journey from its initial public offering in May 1999 to its current status as a Netherlands-domiciled, US-listed infrastructure player reveals a dynamic strategic evolution. Initially, the company leveraged the strong cash flows from its core Spanish construction business to fund diversification and international expansion. Early post-IPO moves included acquiring airport concessions (e.g., Bristol, assets in Mexico and Chile) and expanding into related services like parking, aiming to reduce cyclicality and increase the contribution of non-construction earnings. This historical context underscores a long-standing strategy of using construction capabilities to build a portfolio of infrastructure assets.
The last five years (2020-2024) have witnessed an acceleration and refinement of this strategy, marked by several key shifts and events:
Intensified North American Focus: Ferrovial has decisively prioritized North America, particularly the United States, as its primary growth engine. This is evidenced by the significant proportion of its asset value derived from the region (estimated at 80% by analysts in late 2024), the concentration of its high-performing Managed Lanes portfolio there, and major investments like the JFK New Terminal One. The strategic decision to pursue a triple listing, culminating in its Nasdaq debut in May 2024, further solidifies this North American commitment, aiming for enhanced visibility and access to deeper capital markets.
Systematic Asset Rotation: A defining characteristic of recent years has been the active management of its portfolio through divestments of mature or non-core assets and reinvestment into opportunities perceived to have higher growth potential or better strategic fit. Notable divestments include the sale of a 65% stake in the Ausol toll road in Spain (2019, generating significant capital gains impacting the start of the period), the phased exit from the Services business (largely completed by 2022), the sale of stakes in Indian developer IRB Infrastructure Developers and facility manager Serveo in 2024, and, most significantly, the agreement to sell a large portion of its long-held stake in Heathrow Airport in 2024. Capital has been redeployed into acquiring a 24% stake in IRB Infrastructure Trust in India, funding the development of JFK's NTO, securing new concessions like the Lima Peripheral Ring Road, and expanding its Energy portfolio. This rotation strategy, while generating substantial reported profits and cash, necessitates successful reinvestment to sustain long-term value creation.
Corporate Structure and Domicile: Ferrovial undertook significant corporate restructuring, moving its registered office from the UK to the Netherlands in 2019 and subsequently executing a reverse cross-border merger in 2023, which established the Dutch entity, Ferrovial SE, as the ultimate parent company of the group. These moves were positioned as facilitating international growth, particularly the US listing, and potentially offering a more stable regulatory and tax environment.
Emphasis on Sustainability: Reflecting broader industry trends, Ferrovial has increasingly integrated sustainability into its strategy. This includes setting ambitious carbon reduction targets (aiming for neutrality by 2050), investing in renewable energy through its dedicated Energy division, and highlighting the environmental benefits of its projects (e.g., congestion reduction via Managed Lanes). This focus is underscored by its long-standing inclusion in indices like the Dow Jones Sustainability Index.
Operational and Market Dynamics: The period was heavily influenced by the COVID-19 pandemic, which severely impacted traffic on toll roads and airports in 2020 and 2021, followed by a strong recovery phase. More recently, the inflationary environment has been a key dynamic, with Ferrovial highlighting the ability of its US Managed Lanes' dynamic pricing mechanisms to generate revenue growth significantly outpacing inflation. Major project milestones include the completion and ramp-up of the I-66 Express Lanes and the achievement of first-time dividend distributions from the I-77 and I-66 assets in 2024. The Construction division navigated challenges, including a significant provision booked in 2019 related to US projects, but has since reported improved profitability. The 2024 financial results were dramatically boosted by the capital gain recognized from the Heathrow divestment agreement.
This period represents a fundamental reshaping of Ferrovial, moving from its origins as a Spanish construction firm that diversified internationally, to becoming a Netherlands-domiciled, North America-centric operator focused on high-value transportation infrastructure and the emerging energy transition market. The strategic rationale appears sound, targeting growth in stable, developed markets and aligning with decarbonization trends. However, the execution of this strategy, particularly the successful deployment of capital from divestments into new value-generating assets, remains the central factor determining future performance.
Table: Major Strategic Milestones and Events (IPO - 2024)
III. Analyze the Income Statement (2020-2024)
A. Revenue Trends
Ferrovial's consolidated revenue from continuing operations demonstrated resilience and growth over the 2020-2024 period, navigating the significant disruption of the COVID-19 pandemic and reflecting the company's strategic shifts.
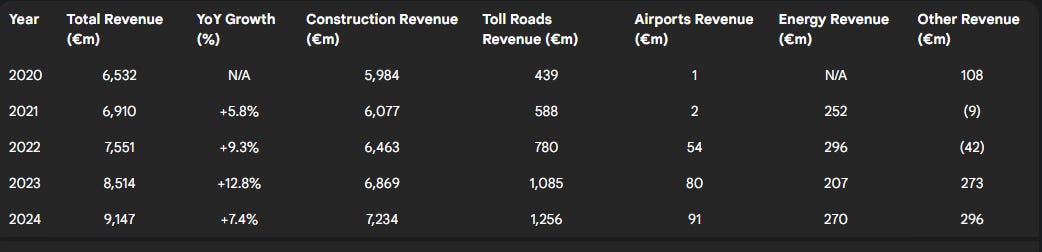
Overall Growth: Consolidated revenues grew from €6,532 million in 2020 to €9,147 million in 2024, representing a Compound Annual Growth Rate (CAGR) of approximately 8.8%. Year-over-year growth was particularly strong between 2021 and 2023 as traffic-dependent businesses recovered from pandemic lows, while 2024 saw continued growth of 6.7% (or 7.4% on a like-for-like basis adjusting for portfolio changes) driven primarily by Toll Roads and Construction. It is important to note these figures represent continuing operations, excluding the divested Services business.
Segmental Contribution:
Construction: Remained the largest segment by revenue throughout the period, growing from €5,984 million in 2020 to €7,234 million in 2024. This reflects a strong order book and execution on projects, particularly in North America and Poland.
Toll Roads: Showed the most dramatic growth trajectory, increasing revenue from €439 million in 2020 to €1,256 million in 2024. This surge was driven by the post-pandemic traffic recovery, the ramp-up of newer assets like I-77 and I-66, and strong performance with dynamic pricing in established US Managed Lanes (NTE, LBJ, NTE 35W).
Airports: Revenue contribution at the consolidated level remained minimal (€1m in 2020 to €91m in 2024). This is primarily because major airport investments like Heathrow (pre-divestment) and JFK NTO are equity-accounted or under construction, meaning their full revenue is not consolidated. The reported revenue likely relates to smaller, fully consolidated airport activities or specific services.
Energy: As a newer segment formalized in late 2021, its revenue contribution grew from negligible levels to €270 million in 2024, reflecting initial project contributions.
Geographic Mix: The strategic focus on North America is evident. While detailed geographic breakdowns are in the full reports, management commentary and asset valuations point to the US and Canada becoming the dominant sources of value and likely revenue growth drivers, particularly for the high-margin Toll Roads segment.
Patterns and Anomalies: The dip and subsequent sharp recovery in Toll Road revenues between 2020 and 2023 directly correlate with pandemic travel restrictions and their lifting. Construction revenue showed more steady growth, reflecting the longer-term nature of its contracts and backlog. The divestment of the Services business affects like-for-like comparisons prior to 2021/2022, but the analysis focuses on continuing operations as reported.
The revenue trend indicates a successful recovery in traffic-dependent assets and sustained growth in construction, underpinned by the strategic focus on North American infrastructure. The Toll Roads segment, particularly the US Managed Lanes, stands out as a key engine of high-quality revenue growth, benefiting from both traffic volume increases and advantageous pricing power. The Energy segment represents a future growth option, currently contributing modestly to the top line.
Table: Consolidated Revenue and YoY Growth (2020-2024)
B. Cost Structure & Margins
Analyzing Ferrovial's cost structure and margins reveals the impact of its business mix and the significant influence of non-operational items in recent years.
Cost Structure: Operating expenses primarily consist of materials consumed/procurements (relevant mainly to Construction), staff costs, and other operating expenses related to concessions and corporate overheads. Total operating expenses (excluding D&A and Impairments/Disposals) rose from €6,128 million in 2020 to €7,806 million in 2024, generally tracking revenue growth.
Gross Margin: While a standard gross margin (Revenue - Cost of Sales) is less applicable given the diverse business mix (concessions vs. construction), focusing on segmental profitability is more insightful.
Operating Margin (EBIT Margin): Reported operating margins have been extremely volatile due to the accounting treatment of large asset disposals.
2024: Reported Operating Profit was €3,109m on €9,147m revenue, yielding a margin of 34.0%. However, this included €2,208m of net gains from disposals (primarily Heathrow). Excluding these gains, the Adjusted Operating Profit (Adjusted EBIT) was €901m, resulting in an Adjusted Operating Margin of 9.85%.
2023: Reported Operating Profit €625m; Margin 7.3%. Adjusted EBIT €590m; Adjusted Margin 6.9%.
2022: Reported Operating Profit €423m; Margin 5.6%. Adjusted EBIT €429m; Adjusted Margin 5.7%.
2021: Reported Operating Profit €1,476m; Margin 21.5%. This included €1,139m in net disposal gains/impairment reversals. Adjusted Operating Profit was therefore €337m, yielding an Adjusted Operating Margin of 4.9%.
2020: Reported Operating Profit €189m; Margin 2.9%. Adjusted Operating Profit €173m; Adjusted Margin 2.6%.
Net Margin: Similarly, reported net margins are skewed by disposals.
2024: Reported Net Margin (Parent) = €3,239m / €9,147m = 35.4%.
2023: Reported Net Margin (Parent) = €460m / €8,514m = 5.4%.
2022: Reported Net Margin (Parent) = €186m / €7,551m = 2.5%.
2021: Reported Net Margin (Parent) = €1,197m / €6,910m = 17.3%.
2020: Reported Net Margin (Parent) = -€424m / €6,532m = -6.5%.
The analysis clearly shows that relying on reported operating or net margins provides a misleading picture of Ferrovial's underlying operational efficiency due to the significant impact of asset rotation gains in 2021 and 2024. The Adjusted Operating Margin, which excludes these major disposals/impairments, offers a more stable view, showing a recovery from a low of 2.6% in 2020 to 9.85% in 2024. This improvement reflects the post-pandemic recovery, strong performance in high-margin Toll Roads, and enhanced profitability in Construction.
The Construction segment's performance is noteworthy. After facing challenges culminating in the 2019 provision, management initiatives like "Project Abacus" and a focus on risk management appear to have yielded results. The segment achieved a 3.9% operating margin in 2024 (€284m profit on €7,234m revenue), surpassing the Horizon 24 target of 3.5%. Achieving consistent profitability in this segment is vital given its scale and role in supporting concession developments.
The Toll Roads segment consistently delivers very high margins at the asset level (often exceeding 70-80% EBITDA margins for mature US Managed Lanes), reflecting the operational leverage and pricing power inherent in these concessions once operational.
Table: Margin Analysis (2020-2024)

C. Profitability Metrics
Examining core profitability metrics like EBITDA and adjusted net income provides further insight into Ferrovial's operational performance, stripping away some of the volatility seen in reported net income.
EBITDA Trends: Ferrovial emphasizes Adjusted EBITDA as a key performance indicator. This metric excludes net financial results, taxes, depreciation, amortization, share of profits from equity-accounted companies, and significantly, impairments and disposals.
Adjusted EBITDA demonstrated a strong growth trend over the period:
2024: €1,342 million (+35.4% YoY)
2023: €991 million (+36.1% YoY)
2022: €728 million (+19.3% YoY)
2021: €610 million (+49.1% YoY)
2020: €409 million (continuing operations)
This consistent growth points to a robust recovery in core operations post-pandemic and underlying profitability improvements, particularly in Toll Roads and Construction.
Net Income Trends: Reported Net Profit Attributable to the Parent Company fluctuated significantly:
2024: €3,239 million (boosted by ~€2bn+ Heathrow gain)
2023: €460 million
2022: €186 million
2021: €1,197 million (boosted by disposal gains/impairment reversals)
2020: -€424 million (loss, impacted by COVID-19)
The quality of reported earnings in 2021 and 2024 is low due to the dominance of one-off gains. The underlying operational profitability trend is better reflected in the Adjusted EBITDA figures or an adjusted net income calculation.
Earnings Growth vs. Revenue Growth: Comparing Adjusted EBITDA growth to revenue growth reveals strong operational leverage, particularly in recent years.
In 2024, revenue grew 7.4% while Adjusted EBITDA grew 35.4%.
In 2023, revenue grew 12.8% while Adjusted EBITDA grew 36.1%.
This indicates that profitability is expanding faster than the top line, likely due to improving margins in Construction, strong pricing power and operating leverage in Toll Roads, and the recovery from pandemic impacts.
The substantial increase in Adjusted EBITDA from €409 million in 2020 to €1,342 million in 2024 strongly suggests that the underlying operational health of Ferrovial's core businesses has significantly improved. While reported net income figures are distorted by asset sales, the core engine appears to be generating increasing profits and cash flow. The loss in 2020 was clearly linked to the unprecedented impact of the pandemic, and the subsequent recovery in Adjusted EBITDA has been consistent. The faster growth in Adjusted EBITDA compared to revenue in 2023 and 2024 points towards effective cost management and the benefits of operating high-margin infrastructure assets.
Table: Profitability Trend Analysis (2020-2024)

D. Earnings Per Share (EPS)
Earnings Per Share (EPS) trends closely mirror the volatility observed in net income, primarily due to the impact of significant one-off items.
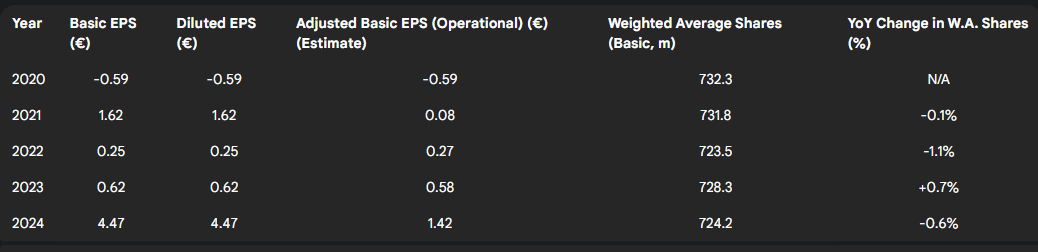
EPS Trends: Basic and Diluted EPS have been identical throughout the 2020-2024 period, indicating minimal impact from dilutive securities like stock options.
2024: €4.47
2023: €0.62
2022: €0.25
2021: €1.62
2020: -€0.59
The spikes in 2021 and 2024 are directly attributable to the large gains from asset disposals recognized in those years, while the negative EPS in 2020 reflects the pandemic's impact. An adjusted EPS figure, removing these one-offs, would show a more gradual recovery and growth trajectory, aligned with the Adjusted EBITDA trend.
Weighted Average Shares: The weighted average number of shares used for basic EPS calculations has remained relatively stable, declining slightly from 732.3 million in 2020 to 724.2 million in 2024. This slight decrease is likely attributable to share repurchase programs executed by the company. The stability in share count means that EPS trends have not been significantly distorted by major share issuances or buybacks, primarily reflecting the underlying net income performance (including one-offs).
The reported EPS figures, while accurate according to accounting standards, are not representative of the company's recurring operational earnings power in years with major divestments. Investors should focus on the trend in Adjusted EBITDA per share or an estimated operational EPS to gauge the underlying performance improvement. The modest reduction in share count over the period provides a slight tailwind to EPS growth.
Table: EPS Analysis (2020-2024)
IV. Examine the Balance Sheet (as of year-end 2020-2024)
A. Asset Analysis
Ferrovial's balance sheet reflects its core identity as a long-term owner and developer of large-scale infrastructure assets. Total assets grew steadily from €23.1 billion at year-end 2020 to €29.0 billion at year-end 2024.
Asset Composition: Non-current assets consistently dominate the balance sheet, accounting for approximately 73.5% of total assets in 2024.
Non-Current Assets: The largest components are "Fixed assets in infrastructure projects" (€14.1 billion in 2024) and "Investments in associates" (€3.0 billion in 2024). These lines represent the carrying value of the company's toll roads, airports (like JFK NTO development), and other long-term concessions and related investments. Their growth reflects ongoing investment (e.g., JFK NTO progress) and acquisitions (e.g., IRB Trust stake), offset by divestments (e.g., Heathrow impacting Investments in associates). Goodwill (€0.5 billion in 2024) and Intangible Assets (€0.1 billion) are relatively small compared to the core infrastructure holdings. Property, Plant & Equipment (PP&E) stood at €0.8 billion in 2024, likely representing construction equipment and corporate facilities.
Current Assets: Primarily composed of Cash and cash equivalents (€4.8 billion in 2024) and Trade and other receivables (€2.2 billion in 2024). Inventories (€0.5 billion in 2024) are relatively minor, mainly relating to the Construction segment.
Significant Changes & Quality: The growth in total assets is driven by investments in new and existing infrastructure projects. The significant cash balance observed at year-end 2021 (€5.5bn) likely reflected proceeds from earlier stages of the Services divestment, while the robust €4.8bn cash balance at year-end 2024 reflects inflows from the Heathrow disposal, offset by significant investments during the year. The quality of assets appears high, centered on long-life infrastructure concessions in primarily developed markets, although the valuation of these assets relies on operational performance and discount rate assumptions. Goodwill impairment has not been a major issue in the reviewed period.
The asset base clearly shows Ferrovial's transformation towards a focused infrastructure owner/operator, with tangible, long-duration assets forming the core of its value proposition. The substantial cash holdings provide significant financial flexibility.
B. Liabilities & Capital Structure
Ferrovial employs a sophisticated capital structure involving both corporate-level (recourse) and project-level (non-recourse) financing. Total liabilities increased from €19.3 billion in 2020 to €20.9 billion in 2024.
Debt Levels: The most critical aspect is the distinction between debt related to specific infrastructure projects (typically non-recourse to the parent) and corporate debt.
Consolidated Net Debt: Including all project debt, this figure stood at €6.1 billion at year-end 2024, slightly up from €6.0 billion in 2023.
Net Debt Ex-Infrastructure Projects: This key metric, highlighted by management, showed a net cash position of €1.8 billion at year-end 2024, improving from a net cash position of €1.1 billion at year-end 2023. This indicates very strong financial health at the corporate level, providing flexibility for dividends, share buybacks, and equity contributions to new projects.
Infrastructure Project Net Debt: This increased from €7.1 billion in 2023 to €7.9 billion in 2024, reflecting ongoing investments drawing down project finance facilities (e.g., for JFK NTO). This debt is expected to be serviced by the cash flows of the respective projects. Total gross financial borrowings (short and long-term) were €11.3 billion in 2024.
Equity Structure: Total equity attributable to the parent company was €6.1 billion at year-end 2024, significantly higher than €3.8 billion in 2023, primarily due to the large net profit incorporating the Heathrow disposal gain. Non-controlling interests (NCI) were substantial at €2.0 billion in 2024, reflecting the stakes held by partners in consolidated infrastructure projects.
Key Ratios & Credit Quality:
Leverage: Traditional Debt-to-Equity ratios can be misleading. Using Total Financial Debt (€11.3bn) / Parent Equity (€6.1bn) gives ~1.86x for 2024. Using Consolidated Net Debt (€6.1bn) / Parent Equity (€6.1bn) gives ~1.0x. The company emphasizes the ex-infrastructure net cash position. The Net Debt / Adjusted EBITDA ratio (consolidated) would be €6,061m / €1,342m = ~4.5x for 2024, which appears high but includes non-recourse debt. Peer Acciona reported 2.90x.
Interest Coverage: Adjusted EBITDA (€1,342m) provides ample coverage for estimated underlying interest expenses.
Credit Ratings: Ferrovial maintains investment-grade ratings of BBB (Stable outlook) from both Standard & Poor's and Fitch. This rating reflects the strength of its core assets, the ex-infrastructure net cash position, and prudent financial management, despite the significant project-level debt.
Ferrovial's capital structure is well-managed, effectively utilizing non-recourse project finance to fund large developments while maintaining a strong, liquid balance sheet at the corporate level. The investment-grade rating provides access to debt capital markets at reasonable costs. The key financial metric remains the net cash position excluding infrastructure projects.
Table: Capital Structure Analysis (2020-2024)

C. Liquidity Metrics
Ferrovial has maintained a healthy short-term liquidity position throughout the 2020-2024 period.
Current Ratio: This ratio, measuring current assets relative to current liabilities, remained consistently above 1.0x, ranging from a high of 1.46x in 2020 to 1.22x in 2024. A ratio above 1.0 generally indicates sufficient current assets to cover short-term obligations.
Quick Ratio (Acid Test): This more stringent measure excludes inventories from current assets. It also remained consistently above 1.0x, ranging from 1.37x in 2020 to 1.14x in 2024. This confirms that the company can meet its current liabilities even without relying on the sale of inventories.
Cash Position: The company held substantial cash and cash equivalents balances, ending 2024 with €4.8 billion. This large cash buffer significantly contributes to its liquidity profile.
Working Capital: Positive working capital (Current Assets - Current Liabilities) was maintained throughout the period, indicating sound management of short-term operational funding needs.
The liquidity ratios consistently above 1.0x, coupled with the significant cash balance and the parent company's net cash position (ex-infrastructure projects), demonstrate strong short-term financial strength. This provides Ferrovial with the capacity to manage operational fluctuations, meet upcoming obligations, and contribute equity to new investments as needed. The slight moderation in ratios from the 2020 peak is not concerning given they remain comfortably above 1.0x.
Table: Liquidity Ratios (2020-2024)

V. Scrutinize the Cash Flow Statement (2020-2024)
A. Operating Cash Flow (OCF)
Ferrovial's ability to generate cash from its core operations has shown improvement over the review period, particularly following the pandemic-affected years.
Net OCF Trends: Cash flow from operating activities was €1,093 million in 2020, dipped to €810 million in 2021 during the recovery phase, and then climbed steadily to €1,002 million in 2022, €1,263 million in 2023, and €1,293 million in 2024. This upward trend from 2021 onwards reflects the recovery in traffic-dependent businesses and improved performance in Construction. The strong 2020 result, despite pandemic impacts on revenue, might have been influenced by positive working capital movements or specific project milestones during that year.
Comparison with Net Income: OCF has generally been more stable and representative of underlying performance than the volatile reported net income figures. In 2024, OCF of €1,293 million compares very favorably to an estimated operational net income (excluding the large Heathrow gain) of around €1.0 billion (see Table in III.C). Similarly, in 2021, OCF of €810 million was substantially higher than the estimated operational net income of €58 million. This consistent generation of OCF in excess of underlying operational profit suggests good earnings quality and efficient cash conversion from operations.
Working Capital: Fluctuations in working capital (receivables, payables, inventories) can impact OCF year-to-year, common in the construction industry. While specific impacts require detailed analysis of the cash flow statement notes, the overall positive OCF trend suggests working capital is being managed effectively.
The strengthening trend in operating cash flow from 2021 to 2024 is a positive indicator of the health of Ferrovial's core business activities. This cash generation capacity is fundamental to funding investments, servicing debt, and providing shareholder returns.
Table: Operating Cash Flow Analysis (2020-2024)

B. Capital Expenditures (CapEx)
Ferrovial's capital expenditures reflect its business model focused on developing and acquiring large, long-term infrastructure assets. Investment levels have fluctuated significantly during the 2020-2024 period.
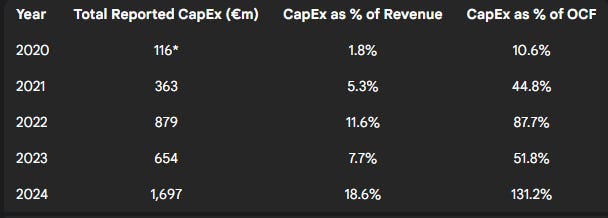
Total CapEx Trends: Reported total investments (including PP&E, intangibles, and infrastructure projects/acquisitions) were:
2024: €1,697 million
2023: €654 million
2022: €879 million
2021: €363 million
2020: €116 million (reported only for PP&E/Intangibles in summary)
The figures show a marked increase in investment activity in 2022 and especially 2024. The very high 2024 figure includes significant equity injections into JFK NTO (€469m) and the acquisition of the IRB Infrastructure Trust stake (€710m), both clearly growth initiatives. Investment levels are inherently lumpy, driven by the timing of major project milestones and acquisitions.
CapEx vs. Revenue/OCF: CapEx represented 18.6% of revenue and 131% of OCF in 2024, highlighting the significant reinvestment rate in that year. In other years, this ratio was lower (e.g., 7.7% of revenue and 52% of OCF in 2023).
Sustainability and Funding: The high CapEx levels, particularly in 2024, exceeded OCF generation. This underscores the reliance on other funding sources, namely asset divestment proceeds (€2.6 billion in 2024) and project-specific financing (reflected in increased infrastructure debt), to fuel growth phases. This dynamic capital allocation is central to the asset rotation strategy.
Maintenance vs. Growth CapEx: Ferrovial's reports do not explicitly segregate maintenance CapEx from growth CapEx. Estimating maintenance CapEx is necessary for valuation purposes (Owner Earnings, DCF). Qualitative analysis indicates a large portion of recent CapEx is growth-related (JFK NTO, IRB Trust, Energy projects, NTE expansion). Depreciation and amortization (€441m in 2024) can serve as a very rough floor for maintenance CapEx, but is likely an underestimate for long-life infrastructure assets requiring periodic refurbishment. The Greenwald method will be used later for a quantitative estimate.
The significant, albeit fluctuating, CapEx demonstrates Ferrovial's commitment to expanding its infrastructure portfolio. The funding model, combining OCF, project debt, and strategic divestments, appears functional given the maintained investment-grade rating and corporate liquidity. However, the long-term sustainability relies on the new investments generating sufficient returns and cash flow.
Table: Capital Expenditure Trends (2020-2024)
C. Free Cash Flow (FCF)
Free Cash Flow (FCF), representing the cash generated after funding operations and investments, has been volatile, reflecting the significant capital investments undertaken.
FCF Calculation (FCF to Firm = OCF - Total CapEx):
2024: €1,293m - €1,697m = -€404 million
2023: €1,263m - €654m = €609 million
2022: €1,002m - €879m = €123 million
2021: €810m - €363m = €447 million
2020: €1,093m - €116m* = €977 million (*Using limited CapEx figure)
The negative FCF in 2024 is a direct consequence of the very high investment level in that year, exceeding the cash generated from operations. The positive FCF in 2021-2023 indicates periods where operating cash flow was sufficient to cover capital investments.
FCF Trends and Uses: The trend is clearly volatile, driven by the lumpiness of CapEx. When FCF is negative, as in 2024, the deficit plus funding for shareholder returns and debt management must come from other sources. In 2024, the €2.6 billion inflow from divestments comfortably covered the €404 million FCF deficit, €574 million in total dividends paid (parent + NCI), a net debt reduction in financing cash flows of €507 million, and share repurchases (part of the €831 million total distribution). In years with positive FCF (2021-2023), this cash, supplemented by divestment proceeds in some years (like 2021), was available for shareholder returns, debt reduction, and building cash reserves.
The volatility in FCF highlights that Ferrovial's capital allocation is dynamic, relying heavily on the timing of large investments and divestments. While operational cash flow is growing, it has not consistently covered the ambitious growth investments in recent years. Shareholder distributions, therefore, have been partly funded by the successful execution of the asset rotation strategy. Assessing the sustainability requires looking at FCF generation over a full investment cycle, including the eventual cash contributions from currently developing assets.
Table: Free Cash Flow Analysis (2020-2024)

VI. Conduct Ratio & Trend Analysis (2020-2024)
A. Profitability Ratios
Profitability ratios like Return on Assets (ROA) and Return on Equity (ROE) measure how effectively Ferrovial generates profits from its asset base and shareholder investments. However, due to the significant one-off gains from disposals in 2021 and 2024, reported ratios are inflated in those years. Analyzing adjusted ratios provides a clearer view of underlying operational profitability.
Return on Assets (ROA): Calculated as Net Income / Average Total Assets.
Reported ROA spiked in 2021 and 2024 due to disposal gains.
Adjusted ROA (using estimated operational net income) shows a more modest trend, improving from negative territory in 2020 to around 3.7% in 2024. This suggests improving efficiency in generating profits from the asset base through core operations.
Return on Equity (ROE): Calculated as Net Income Attributable to Parent / Average Parent Equity.
Reported ROE was exceptionally high in 2024 (~67%) and 2021 (~32%) due to gains. The 2020 ROE was negative.
Adjusted ROE (using estimated operational net income attributable to parent) provides a more meaningful measure of returns generated for shareholders from ongoing business. This adjusted figure shows a recovery from the 2020 loss to approximately 21.6% in 2024. This level significantly exceeds typical estimates for Ferrovial's Cost of Equity (likely in the 5.5%-6.5% range, see Section XI.A), suggesting that the core operations, when profitable, are generating substantial value for shareholders.
While reported profitability ratios are skewed, the adjusted figures indicate a positive trend. The adjusted ROE surpassing the likely cost of equity implies that Ferrovial's core business activities are creating shareholder value, justifying the capital invested. The challenge is maintaining this level of operational return as the company integrates new large-scale investments.
Table: Profitability Ratios (2020-2024)

B. Efficiency & Leverage Ratios
Efficiency ratios gauge asset utilization, while leverage ratios measure financial risk.
Asset Turnover Ratio: (Revenue / Average Total Assets). This ratio remained relatively low and stable, fluctuating between approximately 0.28x and 0.33x over the 2020-2024 period. This is typical for capital-intensive infrastructure companies with large, long-life asset bases. The stability suggests consistent utilization relative to the growing asset base, without dramatic efficiency gains or losses at the consolidated level.
Leverage Ratios: As discussed in Section IV.B, the key leverage metric is the Net Debt / Adjusted EBITDA ratio.
The consolidated ratio (including project debt) decreased from a peak around 8.0x in 2022 to 4.5x in 2024 (see Table in IV.B). This improvement reflects strong EBITDA growth outpacing the increase in net debt. While 4.5x is still relatively high, a significant portion relates to non-recourse project debt. Peer Acciona reported 2.90x in 2024.
The ex-infrastructure net cash position reinforces the low leverage risk at the corporate level.
The stable, albeit low, asset turnover is characteristic of the sector. The improving consolidated leverage ratio (Net Debt/Adjusted EBITDA) is a positive trend, driven by strong earnings growth. The critical distinction remains the low-risk profile at the corporate level due to the ex-infrastructure net cash position.
C. Trend Analysis
Key metrics over the 2020-2024 period highlights several important trends and confirms observations made in previous sections.
Revenue Growth: A dip or slower growth in 2020, followed by accelerating growth through 2023, and continued solid growth in 2024.
Adjusted EBITDA Margin: A clear upward trend from 2020 to 2024, demonstrating improving underlying operational profitability. This contrasts sharply with a chart of Reported Operating Margin, which would show extreme spikes in 2021 and 2024 due to disposals.
Adjusted ROE: Similar to Adjusted EBITDA margin, a chart of Adjusted ROE (operational) would illustrate the recovery from the 2020 loss to healthy positive returns by 2023-2024, significantly exceeding the likely cost of equity.
Net Debt / Adjusted EBITDA (Consolidated): Leverage peaking around 2022 and then declining noticeably in 2023 and 2024, indicating improving debt coverage from operations.
Free Cash Flow to Firm (FCFF): Significant volatility, with positive FCF in 2021-2023 but turning negative in 2024 due to high investment. The 2020 figure would also appear high based on the summary data used.
Key Observations from Trends:
Post-Pandemic Recovery: The trends clearly illustrate the recovery of the business following the COVID-19 impact in 2020.
Improving Operational Efficiency: The consistent rise in Adjusted EBITDA margin and Adjusted ROE points towards genuine improvements in core business profitability.
Impact of Strategy: The high investment in 2024 leading to negative FCF reflects the active deployment phase of the asset rotation and growth strategy. The declining consolidated leverage ratio despite this investment suggests strong earnings growth is providing capacity.
No Major Red Flags (Operational): While reported profits are volatile due to one-offs, the underlying operational trends (Adjusted EBITDA, OCF, Adjusted ROE) are positive. The negative FCF in 2024 is explainable by strategic growth investments funded largely by divestments. The key is future cash generation from these investments.
VII. Review Footnotes & Disclosures
A. Risk Factors & Contingencies
Ferrovial's annual reports disclose a range of risks inherent to its business model and operating environment. Key risk categories include:
Market Risks: Exposure to economic cycles impacting traffic volumes on toll roads and airport passenger numbers. Competition for new projects and concessions is also significant.
Operational Risks: Execution risk on large, complex construction projects, including potential cost overruns and delays (as evidenced by the 2019 provision). Risks associated with operating and maintaining infrastructure assets over long concession periods.
Financial Risks: Interest rate fluctuations impacting the cost of variable-rate debt and refinancing activities. Foreign exchange risk due to significant international operations (primarily USD and CAD exposure). Counterparty risk related to clients, partners, and financial institutions. Liquidity and refinancing risk, although mitigated by the strong corporate cash position and project finance structures.
Regulatory and Political Risks: Changes in government regulations, tolling policies, environmental laws, or political instability in countries of operation can significantly affect concession values and project viability. This is particularly relevant for long-term infrastructure assets. The focus on North America reduces exposure to less stable jurisdictions but concentrates risk in US/Canadian policy environments.
Environmental and Climate Risks: Physical risks from climate change impacting infrastructure assets, and transition risks related to decarbonization policies, carbon pricing, and the shift to sustainable practices. Ferrovial actively manages these through its climate strategy and sustainability initiatives.
Project-Specific Risks: Each major concession (e.g., 407 ETR, US Managed Lanes, JFK NTO) carries specific risks related to its contract terms, demand forecasts, and operating environment.
The company's risk management framework appears comprehensive, addressing these varied exposures. The shift towards North America generally reduces geopolitical risk compared to some emerging markets but increases sensitivity to US political and regulatory dynamics.
B. One-Time Items
Distinguishing recurring operational results from one-time, non-recurring events is crucial for assessing Ferrovial's sustainable performance. The most significant one-time items impacting profitability during the 2020-2024 period were:
Gain on Heathrow Divestment (2024): The agreement to sell a 19.75% stake in Heathrow Airport resulted in a recognized pre-tax gain of approximately €2,023 million, booked under "Impairment and disposal of fixed assets". This was the primary driver of the exceptionally high reported operating and net profit in 2024.
Gains on Other Divestments (2024): Smaller gains were also recognized in 2024 from the sale of stakes in IRB Infrastructure Developers (€132 million) and Serveo (€33 million).
Gains/Impairment Reversals (2021): Reported operating profit in 2021 included a net positive impact of €1,139 million from "Impairment and Disposal of Fixed Assets". This likely included gains from asset sales (potentially related to the Services division divestment process) and possibly reversals of previous impairments.
Construction Provision Impact (Pre-Period - 2019): The €345 million provision taken in 1Q 2019 for potential losses on US construction projects significantly depressed 2019 earnings, setting a lower base for comparison. No similarly large negative provisions were highlighted in the 2020-2024 period, suggesting improved project control or outcomes.
These items, particularly the large disposal gains, significantly distort the reported profitability trends. Excluding these non-recurring events, as done with the Adjusted EBITDA and estimated Adjusted Net Income metrics, provides a much clearer picture of Ferrovial's underlying operational performance improvement over the period.
VIII. Benchmark Against Peers
Comparing Ferrovial to its key competitors – Abertis, Acciona, OHLA, and Skanska – provides context for its financial performance and market positioning. These peers operate in similar sectors (construction, concessions, energy), although their specific business mixes and geographic focuses vary.
A. Industry Comparisons
Financial data for FY2024 (or latest available) reveals relative performance:
Scale and Growth: Ferrovial's 2024 revenue (€9.1bn) places it among the larger players, comparable to Abertis (€6.1bn) but smaller than Acciona (€19.2bn, including Nordex) and Skanska (~€15.4bn). OHLA is smaller (€3.7bn). Ferrovial's 7.4% revenue growth in 2024 was solid, though lower than Abertis (+9.8%), Acciona (+12.7%), and OHLA (+16.6%), potentially reflecting the impact of its Construction scale relative to faster-growing concession recovery or specific project timing at peers. Skanska's revenue growth was higher at 13% (adjusted for currency).
Profitability: Direct margin comparison is challenging due to differing business mixes and reporting (e.g., Ferrovial's large disposal gains in 2024).
EBITDA Margin: Ferrovial's Adjusted EBITDA margin of 14.7% in 2024 appears strong. Abertis, as a pure concessionaire, reported a very high EBITDA margin (70.7%). Acciona's consolidated margin was lower (12.8%) reflecting the mix with Nordex and Infrastructure. OHLA's margin was 3.9%, and Skanska's implied EBITDA margin (calculated) was around 5.3%, reflecting their larger construction components. Ferrovial's blended margin benefits significantly from its high-margin Toll Roads.
Net Margin: Ferrovial's reported 35.4% net margin in 2024 is an outlier due to disposals. Acciona's was 2.2%, OHLA reported a loss (-1.4%), and Skanska's was around 3.1%. On an adjusted basis, Ferrovial's operational net margin (est. 11.3%) appears competitive.
Returns: Ferrovial's adjusted ROE (est. 21.6%) appears strong compared to what might be expected from peers with significant construction exposure.
Leverage: Ferrovial's ex-infrastructure net cash position is a key strength compared to peers who report consolidated net debt. Acciona's Net Debt/EBITDA of 2.90x provides a relevant benchmark for a diversified peer. Abertis carries significantly higher leverage (€22.6bn net debt) typical of its concession-focused model. OHLA reported net cash, while Skanska reported net receivables (also a net cash/receivable position), indicating strong balance sheets also among some construction-heavy peers.
Ferrovial's financial profile reflects its hybrid nature: high margins and value driven by its Toll Road concessions, blended with the larger scale but lower margins of its Construction arm. Its profitability (on an adjusted basis) and corporate balance sheet strength appear competitive within the peer group.
B. Market Positioning
Ferrovial has actively shaped its market position over the last five years, concentrating its efforts and capital towards specific segments and geographies.
Competitive Advantages: Ferrovial's key strengths lie in its integrated model, combining development, financing, construction, and operational expertise, particularly valuable in complex P3 projects. Its track record in delivering and managing large-scale infrastructure, especially the technologically advanced US Managed Lanes, provides a significant competitive edge in this niche. The company's robust corporate financial position allows it to credibly bid for and finance major new developments.
Market Share & Focus: Ferrovial has deliberately strengthened its position in the North American transportation infrastructure market. This is evident through its continued investment in US Managed Lanes, securing the JFK NTO project, and the strategic decision to list on Nasdaq. By divesting assets in other sectors (Services) or regions/assets with potentially lower growth or strategic fit (Heathrow, Ausol), it has focused its resources on this core market. The Construction division's large order book, with significant contributions from the US and Poland, supports this positioning.
Emerging Positions: The creation and expansion of the Energy division signal an intent to build a meaningful position in the renewable energy and transmission sector. While currently small relative to the established businesses, this move targets a high-growth industry driven by global decarbonization efforts. Success here will depend on competing effectively against established energy players.
Ferrovial is not attempting to be the largest player across all infrastructure subsectors globally. Instead, it is carving out a strong, defensible position in high-value transportation infrastructure in North America, leveraging its specific expertise in Managed Lanes and complex P3s. The Energy division represents a strategic diversification into an adjacent growth area. This focused strategy appears well-aligned with industry trends and the company's core competencies.
IX. Assess Qualitative Aspects
A. Management Discussion & Analysis (MD&A)
Management commentary within Ferrovial's annual reports consistently emphasizes strategic priorities centered on value creation through infrastructure development and operation, active portfolio management (asset rotation), and a disciplined approach to capital allocation.
Performance Commentary: Management highlights strong operational performance, particularly in the Toll Roads segment (US Managed Lanes outpacing inflation) and the improving profitability of the Construction division, as key achievements in recent years. The successful execution of major divestments, like Heathrow, is presented as validation of the asset rotation strategy, unlocking value and providing capital for reinvestment. Challenges, such as the impact of COVID-19 or past issues in Construction, are generally acknowledged, although the focus is typically on recovery and future prospects.
Strategic Vision: The "Horizon 24" strategic plan (and likely its successor) emphasizes sustainable infrastructure, focusing on developed markets (especially North America), operational excellence, innovation, and financial discipline. The move to the Netherlands and the US listing are framed as integral parts of enabling this international strategy. Management communicates a clear vision of evolving Ferrovial into a more focused, higher-value infrastructure player.
Outlook: Management typically provides a positive outlook, citing strong fundamentals in core markets, a robust project pipeline, and opportunities arising from infrastructure spending programs and the energy transition.
Credibility: Management communication appears generally credible and consistent with the company's actions (e.g., following through on asset rotation and North American focus). The use of defined APMs like Adjusted EBITDA provides transparency into underlying operational performance, separate from volatile disposal gains.
Overall, the MD&A portrays a management team executing a clear, long-term strategy focused on optimizing the infrastructure portfolio and concentrating on high-potential markets, while maintaining financial discipline.
B. Operational Efficiency
Ferrovial actively pursues operational improvements and innovation initiatives across its businesses.
Cost Control & Efficiency: Specific programs have been implemented, particularly in the Construction division, to enhance efficiency and manage costs. "Project Abacus" was launched in 2020 aimed at improving operating processes and risk management. Management also highlighted achieving €49 million in annualized overhead savings through organizational restructuring around 2020. The improvement in the Construction segment's profitability suggests these measures have had a positive impact.
Innovation & Digitalization: Ferrovial emphasizes innovation as a driver of efficiency and future growth. This includes integrating digital solutions for asset management and operational optimization, exploring connected corridor initiatives like "AIVIA", and potentially applying advanced technologies in project design and execution. The company also collaborates with institutions like MIT to foster innovation.
Sustainability Initiatives: Efforts to improve environmental performance, such as reducing carbon emissions and increasing waste recycling, also contribute to operational efficiency by reducing resource consumption and potentially lowering long-term operating costs.
While the direct financial impact of each initiative is not always quantified in the reports, the consistent focus on efficiency, digitalization, and sustainability suggests a proactive approach to improving operations and maintaining competitiveness. The turnaround in Construction margins serves as tangible evidence of successful operational improvement efforts.
X. Synthesize Your Findings
A. Overall Financial Health
Integrating the quantitative analysis and qualitative insights provides a holistic view of Ferrovial's financial health. The company exhibits a dual financial profile: exceptional strength and flexibility at the corporate level, combined with significant, but largely ring-fenced, debt associated with its infrastructure projects.
Strengths: The standout feature is the robust corporate balance sheet, consistently showing a net cash position when excluding non-recourse infrastructure debt. This provides significant financial flexibility. Liquidity is strong, with current and quick ratios comfortably above 1.0x. The company maintains investment-grade credit ratings from S&P and Fitch, ensuring access to capital markets. Core operational profitability, measured by Adjusted EBITDA, shows a strong upward trend post-pandemic.
Weaknesses/Complexities: Reported net income and EPS are highly volatile due to the significant impact of gains from the asset rotation strategy. Consolidated leverage ratios (including project debt) appear higher than some diversified peers, although the non-recourse nature mitigates risk to the parent. Free cash flow generation has been inconsistent, turning negative in 2024 due to heavy investment, highlighting the reliance on divestment proceeds or new financing to fund peak growth phases.
Conclusion: Ferrovial's overall financial health is sound, particularly at the holding company level. The structure effectively isolates project-specific financial risks while the core company maintains significant liquidity and financial flexibility. The primary financial management challenge lies in balancing the funding needs of large, lumpy growth investments with maintaining balance sheet strength and providing shareholder returns, a task heavily supported by the ongoing asset rotation strategy.
B. Growth & Sustainability
Ferrovial's current performance and strategic direction suggest moderate, but potentially sustainable, long-term growth, although reliant on successful execution and continued portfolio management.
Growth Drivers: Sustainable growth is expected to come from:
Toll Roads: Continued traffic growth and tariff escalation (often outpacing inflation) in existing assets, particularly US Managed Lanes. Ramp-up of newer assets (I-66, potentially Lima).
Airports: Successful completion and operational ramp-up of the major JFK NTO project.
Construction: Execution of the large existing order book (€15.6bn in 2023), potentially replenished by new P3 projects and external contracts.
Energy: Gradual expansion through development and acquisition of renewable energy and transmission assets.
Sustainability of Growth: While operational growth drivers exist, the high reported profit growth in recent years has been heavily reliant on non-recurring divestment gains. The sustainability of the overall growth trajectory depends on the successful reinvestment of divestment proceeds into new assets that generate comparable or superior long-term returns and cash flows. The asset rotation strategy itself, while effective to date, may face challenges if attractive divestment or acquisition opportunities become scarce or valuations less favorable.
ESG Commitment: Ferrovial's strong and long-standing commitment to ESG principles is a positive factor for long-term sustainability. It enhances reputation, potentially lowers the cost of capital, aligns with regulatory trends, and improves competitiveness in securing projects where sustainability is a key criterion.
The growth outlook is positive but contingent. The core US transportation assets provide a strong foundation, but future growth relies heavily on executing the current pipeline (JFK, Energy, Lima) profitably and continuing to successfully recycle capital.
C. Future Outlook
Overall Outlook: Ferrovial is well-positioned to benefit from long-term infrastructure investment trends, particularly in its core North American market. The strategic shift towards higher-value assets and sustainable infrastructure appears sound. The next 3-5 years will be critical for demonstrating successful execution on the current large project pipeline (especially JFK NTO) and proving the value-creation potential of the Energy division. Assuming successful project delivery and continued disciplined capital allocation, Ferrovial should deliver moderate earnings growth and potentially enhanced shareholder returns, supported by its strong financial position. However, execution risks and macroeconomic factors remain key variables.
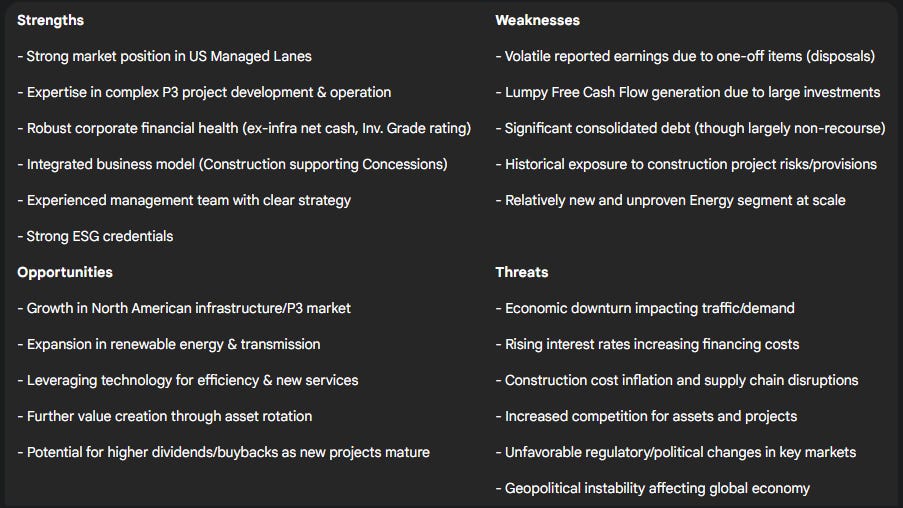
Table: SWOT Analysis Summary
XII. Conclusion & Recommendations
A. Investment Thesis
Ferrovial SE represents a company in the midst of a significant, well-executed strategic transformation. It has successfully shifted its focus towards high-value transportation infrastructure assets in stable, developed markets, particularly North America, while divesting non-core businesses and recycling capital into growth opportunities, including an emerging Energy division. The core US Managed Lanes portfolio provides a foundation of high-margin, inflation-resilient cash flows, and the Construction segment has demonstrated improved profitability. Financially, the company maintains a strong corporate balance sheet with ample liquidity, supporting an investment-grade credit rating.
However, the investment case is not without complexities. Reported earnings have been significantly boosted by large, non-recurring gains from asset sales, masking more modest underlying operational profit growth. Future growth is heavily dependent on the successful execution of large-scale, capital-intensive projects like JFK NTO and the profitable expansion of the relatively new Energy segment. Free cash flow generation is volatile due to these investments, making the company reliant on continued successful asset rotation or project financing to fund peak investment phases and shareholder returns simultaneously.
Shares appear fairly valued here. I still like the business and will continue to hold shares.