


Navigating the Solarcoaster: An Equity Report on Enphase Energy
$ENPH - Pass

Summary
Enphase Energy, Inc. ($ENPH) stands as a prominent global energy technology company, renowned for its microinverter-based solar and battery systems. The company is strategically evolving from a component supplier into a provider of integrated home energy solutions, encompassing solar generation, storage, EV charging, and energy management software. This transition aims to capitalize on the secular trends of electrification and renewable energy adoption.
Financially, Enphase experienced a period of explosive growth between 2020 and 2022, with revenue surging from approximately $774 million to over $2.3 billion. Profitability metrics, including gross and operating margins, expanded significantly during this phase, driven by scale, operational leverage, and favorable market conditions. However, the period from 2023 through the first quarter of 2025 has been marked by a sharp deceleration, with revenue contracting in 2024 to $1.33 billion. This slowdown reflects broader industry headwinds, including channel inventory destocking, softening demand in key markets like the US (partially due to policy changes like California's NEM 3.0 and higher interest rates), and ongoing macroeconomic uncertainty. While the Inflation Reduction Act (IRA) provides tailwinds through manufacturing tax credits (45X) and potentially increased demand via domestic content incentives, recent margin pressure is evident, exacerbated by upcoming tariff impacts, particularly on battery components sourced from China. Management has responded with restructuring actions initiated in late 2024 to align costs with the current environment.
Valuation analysis suggests a wide range of potential intrinsic values, reflecting the significant uncertainty surrounding the company's near-term recovery and long-term growth trajectory. A Discounted Cash Flow (DCF) model, incorporating assumptions around revenue recovery, margin stabilization (factoring in IRA benefits and tariff headwinds), and a terminal exit P/E multiple of 30x (reflecting historical growth potential tempered by current risks), yields an estimated intrinsic value of $65 - $85 per share. A valuation based on Warren Buffett's Owner Earnings concept, which adjusts net income for non-cash charges and estimated maintenance capital expenditures, results in a comparable valuation range of $60 - $80 per share, depending on normalization assumptions. Based on the current market price (approximately $46 per share as of mid-May 2025) and projected free cash flows leading to an estimated exit value based on the 30x P/E multiple in five years, the implied 5-year forward Internal Rate of Return (IRR) is estimated to be approximately 18-22%.
The core investment thesis centers on whether Enphase's strong technological position, integrated ecosystem strategy, and robust balance sheet can navigate the current industry downturn and capitalize on the long-term residential solar and storage market growth, justifying a valuation premium despite significant near-term risks. The recent sharp contraction and margin pressures raise concerns, but the company remains a key innovator in a growing sector.
Key risks include intense competition, sensitivity to policy changes and interest rates, supply chain vulnerabilities (especially battery tariffs), execution risks associated with US manufacturing ramp-up and cost management, and overall market cyclicality.
Based on the analysis, Enphase faces considerable headwinds, but its current valuation appears to reflect much of the near-term negativity. For long-term investors with a higher risk tolerance who believe in the secular growth of home energy solutions and Enphase's ability to execute its strategic pivots, the potential forward IRR suggests the stock may offer value. However, significant uncertainty remains. Close monitoring of quarterly results, particularly revenue growth trends, gross margins ex-IRA/tariffs, channel inventory levels, and progress on supply chain diversification, is crucial.
1. Business & Industry Context
Company Overview
Business Model: Enphase Energy, Inc. operates as a global energy technology company specializing in the design, development, and sale of home energy solutions. Its core focus is on managing solar generation, energy storage, and control/communications through an integrated platform. The company primarily targets the residential and small commercial solar markets. Its go-to-market strategy relies heavily on selling products through a network of solar distributors, who then supply installers. Enphase also engages in direct sales to select large installers, original equipment manufacturers (OEMs), and strategic partners. A growing emphasis is being placed on expanding its direct-to-consumer sales channel via its website.
Core Products: Enphase offers a suite of hardware and software products designed to work together:
IQ Microinverters: These are semiconductor-based devices that convert direct current (DC) generated by a single solar module into usable alternating current (AC). This module-level power electronics (MLPE) approach contrasts with traditional string inverters. The current generation, IQ8™ series, is shipped globally and features capabilities like grid-forming operation for backup power without a battery. Specific models (IQ8HC™, IQ8X™, IQ8P-3P) are manufactured in the US to leverage domestic content benefits.
IQ Batteries: Enphase provides scalable residential energy storage solutions. These batteries utilize lithium iron phosphate (LFP) chemistry and are managed by the company's proprietary Ensemble OS™ software, enabling functions like backup power, time-of-use optimization, and self-consumption. The latest iteration, IQ Battery 5P, offers higher power output and capacity.
EV Chargers: The company offers smart electric vehicle chargers (IQ EV Chargers) designed to integrate with its solar and battery systems, allowing homeowners to charge vehicles using solar energy to minimize electricity costs.
Software Platform: A critical component of the ecosystem includes the Enphase Installer App for system commissioning, the Enlighten cloud-based monitoring platform (via the Enphase App) for homeowners, the Solargraf platform for solar design and proposal generation, and other digital tools for lead generation and service provision.
Revenue Streams: Revenue is predominantly generated from product sales. Geographically, the United States has historically been the largest market, accounting for 70% of net revenues in 2024. This represents a rebound from 64% in 2023 but is still below the 76% share in 2022. Europe is the second most significant region, contributing 23% of net revenues in 2024, down from 31% in 2023. The variability in the US revenue contribution, despite reports of softening domestic demand, alongside a declining European share, points towards significant volatility in regional performance. This fluctuation is likely influenced by a complex interplay of factors including relative demand shifts between regions, inventory corrections in distribution channels, differing impacts of energy policies (like NEM 3.0 in the US), and the specific timing of product launches and strategic initiatives like the US manufacturing ramp.
Manufacturing Strategy & IRA Implications
Enphase utilizes an asset-light manufacturing model, relying on third-party contract manufacturers such as Flex Ltd., Salcomp Plc., and Sunwoda Electric Co. Ltd.. Historically, production was concentrated in lower-cost regions like Mexico and China. However, the passage of the Inflation Reduction Act (IRA) in the US prompted a significant strategic pivot. Enphase established US-based contract manufacturing operations in South Carolina and Texas to produce IQ Microinverters and, more recently, IQ Batteries.
This move is primarily driven by two key IRA provisions:
Advanced Manufacturing Production Tax Credits (AMPTC): Section 45X of the IRA provides tax credits for domestically produced clean energy components. For microinverters, this credit is initially 11 cents per AC watt, providing a substantial potential boost to gross margins for US-made units. Enphase began booking these credits in 2023 and shipped approximately 1.21 million eligible microinverters from its US facilities in Q1 2025. The value of these credits is scheduled to phase down by 25% annually from 2030 through 2032.
Domestic Content Bonus ITC: The IRA offers an additional 10% Investment Tax Credit (ITC) for solar projects that meet certain domestic content requirements. By manufacturing microinverters and batteries in the US, Enphase aims to help its customers' projects qualify for this bonus credit, potentially stimulating demand for its US-made products, particularly in the residential lease/PPA and commercial segments.
The strategic shift towards US manufacturing, therefore, offers potential margin enhancement and a demand catalyst. However, it also introduces complexities. Ramping up new manufacturing lines carries execution risk, and the underlying cost of manufacturing in the US (excluding credits) may be higher than in established overseas locations. Furthermore, the reliance on these tax credits introduces sensitivity to future legislative changes or evolving regulatory interpretations.
A notable aspect of Enphase's recent reporting is "Safe Harbor" Revenue. This is defined as revenue from sales made to customers who intend to install the purchased inventory over a period exceeding one year. In Q1 2025, this accounted for $54.3 million, partially offsetting declines in regular US demand. The company guided for approximately $40.0 million in safe harbor revenue for Q2 2025. The existence of this revenue category suggests advance purchasing by some customers, possibly to secure pricing, manage long-term project pipelines, or perhaps hedge against potential future supply constraints or policy changes. While beneficial for smoothing revenue in the short term, it can obscure the underlying real-time demand trends within the market and may indicate inventory building in the channel beyond immediate installation needs. Analysts should consider segmenting this revenue when assessing organic growth momentum.
Market Analysis
Enphase operates within the dynamic and rapidly expanding global markets for solar photovoltaics (PV) and energy storage systems. Market growth is propelled by several factors, including declining solar system costs, increasing consumer and business demand for renewable energy solutions, concerns about grid reliability, aspirations for energy independence, and supportive government policies and financial incentives worldwide.
The microinverter segment, where Enphase holds a leading position, is projected for substantial growth over the next decade. Forecasts suggest Compound Annual Growth Rates (CAGRs) ranging from approximately 14.5% to 19.0% through 2032. Depending on the source and methodology, the global microinverter market size is estimated to reach between $14.9 billion and $67.0 billion by 2032. Key drivers underpinning this growth include continuous technological advancements leading to improved efficiency and reliability, the accelerating deployment of distributed solar generation (residential and commercial rooftops), and rising conventional electricity prices in many regions. Currently, the residential sector and grid-connected (on-grid) systems represent the largest segments of the microinverter market.
Competitive Landscape
The solar technology and home energy market is intensely competitive. Enphase faces competition across its product lines:
Inverters: Key competitors include manufacturers of string inverters (like SMA Solar Technology AG, Huawei), optimizers coupled with string inverters (led by SolarEdge Technologies), and other microinverter providers (such as APSystems, Hoymiles, Deye, and Generac following its acquisition of Chilicon Power).
Battery Storage: Competitors include established players like Tesla (Powerwall), LG Energy Solution, BYD, as well as numerous other battery manufacturers and system integrators.
EV Charging: The market includes dedicated EV charging companies like Wallbox and ChargePoint, as well as diversified electrical equipment manufacturers.
Integrated Systems: Companies like Tesla and SunPower offer integrated solar and storage solutions, competing directly with Enphase's ecosystem approach. SunPower's recent bankruptcy filing adds complexity, although Enphase has reported onboarding former SunPower monitoring customers.
Enphase is widely recognized as a market leader, particularly in the microinverter space, often differentiated by its technology's performance (module-level optimization, reliability), ease of installation, integrated system design, and robust software platform. However, the competitive landscape is dynamic, characterized by rapid innovation, price pressure, and consolidation (e.g., Generac/Chilicon). Enphase's success hinges not only on maintaining its technological edge in microinverters but also on effectively integrating its broader product suite (storage, EV charging, software from acquisitions like GreenCom Networks) into a compelling and seamless home energy management system. This is crucial for competing against rivals who may offer different technological approaches, broader product portfolios, or leverage cost advantages, particularly from Asian manufacturers.
Strategic & Operational Context
Strategic Shifts: Enphase has deliberately evolved its strategy from being primarily a microinverter supplier to becoming a provider of comprehensive home energy management systems. This involves integrating storage, EV charging, load control, and software onto a unified platform. Key strategic pillars include enhancing customer experience, expanding global market share (including Europe, APAC, Latin America), continuous product innovation focused on performance and cost reduction, and strengthening partnerships with distributors and installers, alongside building direct-to-consumer capabilities. The IRA-driven shift to US manufacturing represents a major recent strategic adaptation.
Acquisitions: To accelerate its strategic transition, Enphase has made several acquisitions in recent years, including GreenCom Networks AG (energy management software), ClipperCreek (EV charging), and various solar software companies focused on design, proposal, and lead generation. While these acquisitions bring critical technology and market access, successful integration is paramount and carries inherent risks related to culture, technology compatibility, and achieving synergies. The introduction of the IQ Energy Router™ in Europe, integrating third-party devices, likely leverages technology from the GreenCom acquisition.
Restructuring: In response to the market slowdown experienced in 2023 and 2024, Enphase implemented a significant restructuring plan in the fourth quarter of 2024. This involved a global workforce reduction of approximately 17% and the planned cessation of operations at its contract manufacturing facility in Mexico during the first half of 2025. This action signals management's effort to realign operating expenses with lower near-term revenue expectations and protect profitability. While necessary for cost control, such measures can potentially impact employee morale and execution capacity during a period of strategic transition and product development. The timing suggests an acknowledgment that the market softness could be more persistent than initially hoped.
Tariff Impacts: The imposition of new US tariffs on goods imported from China and anticipated reciprocal tariffs from other countries represents a significant near-term headwind for Enphase. Management indicated that while microinverters might see minimal impact due to supply chain diversification, battery systems are highly exposed, with approximately 95% of battery cell packs sourced from China as of early 2025. The estimated gross margin impact is around 2 percentage points in Q2 2025 (mitigated by existing inventory), potentially rising to a 6-8% total gross margin impact starting in Q3 2025, even after accounting for potential pricing adjustments. Enphase plans to mitigate this by diversifying its battery cell supply chain away from China, aiming to ease the margin impact by the second quarter of 2026. This situation adds considerable uncertainty to margin forecasts and underscores the execution risk associated with complex global supply chains.
Demand Environment: The company faced challenging demand conditions through 2024 and into Q1 2025. Factors contributing to this include high channel inventory levels built up previously, softening end-market demand in the US due to higher interest rates impacting financing costs for solar systems, and policy changes like California's NEM 3.0 transition which reduced the economic attractiveness of solar-only systems. Seasonality also typically leads to softer demand in the first quarter. While Europe showed some strength in Q1 2025 driven by battery sales, the region had experienced declines in 2024 compared to 2023. Unfavorable macroeconomic conditions remain a potential drag on consumer spending for large-ticket items like solar and storage systems.
Regulatory Factors: Enphase's business is highly sensitive to government policies and regulations. Tax incentives like the US federal ITC and the IRA's manufacturing (45X) and domestic content credits are significant drivers of economics for the company and its customers. Changes to net energy metering (NEM) rules, which govern how solar owners are compensated for excess energy sent to the grid, can dramatically impact solar adoption rates, as seen with California's NEM 3.0. Trade policies, such as tariffs, also directly affect costs and margins.
2. Financial Performance
Income Statement Analysis
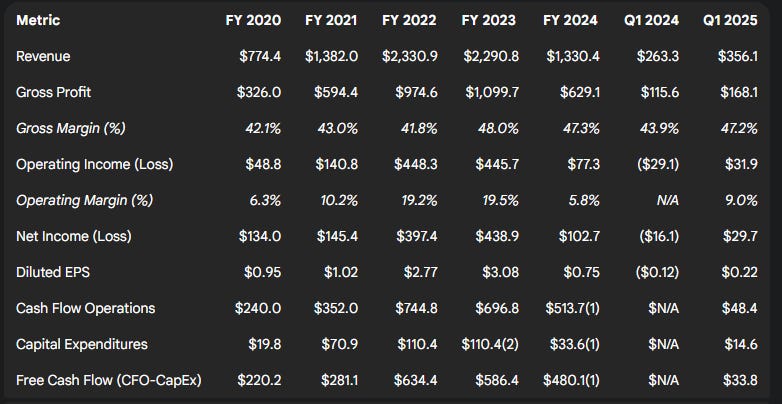
Revenue Trends: Enphase exhibited a period of hyper-growth, with annual revenues expanding dramatically from $774.4 million in 2020 to $1.38 billion in 2021, peaking at $2.33 billion in 2022. Revenue remained relatively flat in 2023 at $2.29 billion before contracting sharply by 42% to $1.33 billion in 2024. This trajectory highlights the cyclical nature of the solar market and the impact of recent headwinds. For the first quarter of 2025, revenue was $356.1 million. While this represented a significant 35% increase compared to a particularly weak Q1 2024 ($263.3 million), it marked an approximate 7% sequential decline from Q4 2024 ($382.7 million), indicating continued softness in demand and the effects of seasonality. The sharp deceleration and subsequent contraction after 2022 suggest a confluence of factors at play: the unwinding of excess channel inventory built during the boom years, demand suppression from significantly higher interest rates affecting project finance, adverse policy shifts like California's NEM 3.0, and potentially intensifying competition. A central question for investors is the company's ability to navigate these challenges and reignite sustainable top-line growth.
Cost Structure & Margins:
Gross Profit & Margin: Gross profit followed the revenue trajectory, growing from $326.0 million in 2020 to $1.1 billion in 2023, before falling to $629.1 million in 2024. GAAP Gross Margin showed considerable strength, improving from approximately 42.1% in 2020 to a peak of around 48.0% in 2023, before settling at 47.3% in 2024. The improvement likely reflects benefits from economies of scale, product mix shifts towards higher-margin storage, and, significantly in 2023 and 2024, the positive impact of IRA manufacturing tax credits. Q1 2025 GAAP Gross Margin was 47.2%, down from 51.8% in Q4 2024 but up from 43.9% in Q1 2024. The non-GAAP Gross Margin for Q1 2025 was 48.9% (including IRA benefit), a sequential decrease from 53.2% in Q4 2024. Excluding the net IRA benefit (estimated at 10.6% in Q1 2025), the non-GAAP Gross Margin was 38.3%, down from 39.7% in Q4 2024, attributed primarily to product mix and lower bookings of 45X credits. Guidance for Q2 2025 points to further pressure, with non-GAAP Gross Margin expected between 44.0%-47.0% including IRA benefits, but only 35.0%-38.0% excluding them. This guidance also incorporates an estimated 2 percentage point negative impact from new tariffs. The substantial gap between GAAP and non-GAAP margins is primarily driven by stock-based compensation, acquisition-related amortization, and restructuring charges. The underlying margin trend, stripped of IRA benefits and facing tariff headwinds, indicates pressure on core profitability.
Operating Expenses & Margin: GAAP Operating Expenses grew with the business scale but were managed effectively during the growth phase, leading to significant operating leverage. GAAP Operating Income grew from $48.8 million in 2020 (6.3% margin) to $448.3 million in 2022 (19.2% margin) and $445.7 million in 2023 (19.5% margin), before declining sharply to $77.3 million (5.8% margin) in 2024. The Q4 2024 restructuring aimed to reduce operating expenses; Q1 2025 non-GAAP operating expenses decreased sequentially to $79.4 million from $83.3 million in Q4 2024 as a result. Q1 2025 GAAP Operating Income was $31.9 million, yielding an operating margin of approximately 9.0%. The strong operating leverage demonstrated during the growth years worked in reverse during the 2024 contraction, emphasizing the importance of the recent cost reduction measures.
Profitability Metrics:
Net Income: GAAP Net Income tracked the trends in revenue and margins: $134.0 million (2020), $145.4 million (2021), $397.4 million (2022), $438.9 million (2023), and $102.7 million (2024). Q1 2025 saw GAAP Net Income of $29.7 million, a significant improvement from the $16.1 million loss in Q1 2024, but down from $62.2 million in Q4 2024. Q1 2025 non-GAAP Net Income was $89.2 million.
EBITDA: Commonly used as a proxy for cash operating profit, EBITDA (as reported by sources, definitions may vary slightly) grew substantially from $204.5 million in 2020 to $612.4 million in 2023, before falling to $223.6 million in 2024. Trailing Twelve Month (TTM) EBITDA as of Q1 2025 was reported at $226.0 million.
Earnings Per Share (EPS):
Diluted EPS (GAAP): Followed the net income pattern: $0.95 (2020), $1.02 (2021), $2.77 (2022), $3.08 (2023), $0.75 (2024). Q1 2025 GAAP Diluted EPS was $0.22, compared to -$0.12 in Q1 2024. TTM GAAP Diluted EPS was reported as $1.09.
Diluted EPS (Non-GAAP): Q1 2025 non-GAAP Diluted EPS was $0.68, compared to $0.35 in Q1 2024 and $0.94 in Q4 2024.
Share Count: Diluted weighted average shares outstanding have fluctuated, generally between 140 million and 153 million over the past few years. The company has engaged in share repurchases, including spending approximately $100 million to buy back 1.6 million shares in Q1 2025. These buybacks help offset dilution from stock-based compensation but the significant amount of outstanding convertible senior notes represents a potential source of future dilution if the stock price appreciates substantially, triggering conversion.
Balance Sheet Assessment
Asset Analysis: Total Assets grew significantly alongside the business, from $1.17 billion at year-end 2020 to $3.38 billion at year-end 2023, before slightly decreasing to $3.25 billion at year-end 2024. The asset base is heavily weighted towards current assets, primarily Cash and Marketable Securities, Accounts Receivable, and Inventory. Working Capital remained strong at $1.67 billion at the end of 2024. Goodwill and Net Intangible Assets resulting from acquisitions were relatively modest at approximately $254 million combined at year-end 2024.
Liabilities & Capital Structure: Total Liabilities increased from $716 million at year-end 2020 to $2.42 billion at year-end 2024, driven largely by the issuance of convertible senior notes. Total Debt outstanding has remained relatively stable around $1.2 - $1.3 billion in recent years, consisting primarily of these convertible notes due in 2025, 2026, and 2028. The company paid off $102.2 million principal amount of notes maturing March 1, 2025, during Q1 2025. The Debt-to-Equity ratio has consequently increased significantly, from approximately 68% at year-end 2020 to reported figures of 148%-152% more recently. While this indicates higher leverage, it is substantially mitigated by the company's large cash holdings. Net Debt is considerably lower. Interest Coverage was robust during peak profitability but has declined with lower EBIT. Using FY2024 GAAP EBIT of $90.4M and Interest Expense of $8.9M, the coverage ratio was approximately 10.1x.
Liquidity Metrics: Enphase maintains a strong liquidity position. At the end of Q1 2025, the company held $1.53 billion in cash, cash equivalents, restricted cash, and marketable securities. This cash balance comfortably exceeds the total outstanding debt. The Current Ratio was reported at 1.89x (MRQ), indicating sufficient liquid assets to cover short-term liabilities. The substantial cash reserves provide significant financial flexibility to weather the current downturn, fund ongoing operations and investments (including US manufacturing), pursue potential further acquisitions, and manage debt maturities. The key challenge is deploying this capital effectively to generate adequate returns.
Cash Flow Review
Operating Cash Flow (CFO): Enphase has demonstrated a strong ability to generate cash from its core operations, closely tracking profitability trends. CFO grew from $240.0 million in 2020 to a peak of $744.8 million in 2022, before moderating to $696.8 million in 2023 and $513.7 million (TTM ending Q4 2024). CFO in Q1 2025 was $48.4 million. Cash flow generation is primarily driven by net income, adjusted for significant non-cash items like stock-based compensation (historically $100M-$200M+ annually) and depreciation & amortization, as well as changes in working capital.
Capital Expenditures (CapEx): Historically modest for an asset-light company, CapEx increased significantly during the growth phase and strategic shift to US manufacturing. CapEx was $19.8 million in 2020, rising to $70.9 million in 2021, $110.4 million in 2022, and remaining elevated near $110 million in 2023 (estimated from TTM changes). TTM CapEx ending Q4 2024 was lower at approximately $33.6 million. However, Q1 2025 CapEx was $14.6 million, higher than the $8.1 million in Q4 2024, suggesting continued investment, likely related to US manufacturing expansion and R&D infrastructure.
Free Cash Flow (FCF): Enphase has been a robust FCF generator. Calculated FCF was approximately $220 million (2020), $281 million (2021), $634 million (2022), $587 million (2023), and $480 million (TTM ending Q4 2024). In Q1 2025, FCF was $33.8 million ($48.4M CFO - $14.6M CapEx). Strong FCF has historically enabled the company to fund operations, make acquisitions, and repurchase shares without heavy reliance on external financing (other than the convertible notes issued during favorable market conditions). The recent compression in FCF due to lower CFO and sustained (though moderated) CapEx highlights the importance of stabilizing profitability and managing investments prudently to maintain this financial strength.
Ratio & Trend Analysis
Profitability Ratios:
Return on Equity (ROE): ROE has been highly volatile, mirroring the swings in net income and changes in the equity base (affected by stock issuance/repurchases and retained earnings). It likely peaked significantly above 20% during 2022-2023 but has since declined. TTM ROE as of Q1 2025 was reported at 17.1%. Compared to peers, this TTM figure is substantially better than SolarEdge's negative ROE but lags SMA Solar's strong 32.9% TTM ROE.
Return on Assets (ROA): ROA followed a similar pattern but at lower levels due to the growing asset base. TTM ROA as of Q1 2025 was 3.0%. Again, this compares favorably to SolarEdge's negative TTM ROA but is well below SMA Solar's 13.9%.
Efficiency & Leverage Ratios:
Asset Turnover: (Revenue / Average Total Assets) likely decreased in 2024 as revenue fell while the asset base remained large. Efficient asset utilization will be key during the recovery phase.
Debt/EBITDA: This leverage metric has also increased due to the sharp decline in TTM EBITDA. Using TTM EBITDA of $226M and Total Debt of $1.23B, the ratio is approximately 5.4x. This appears higher than peers like SolarEdge and SMA Solar, which reported negative net debt relative to EBITDA (indicating net cash positions), although Enphase's large cash balance needs consideration for a net debt perspective.
Trend Analysis: The last five-year period clearly shows two distinct phases: 1) Rapid growth, margin expansion, and strengthening profitability ratios (2020-2022/early 2023). 2) Sharp contraction in revenue, pressure on margins (despite IRA benefits), declining profitability ratios, but maintained liquidity (late 2023-2024/Q1 2025). Leverage has increased, but remains manageable given the cash position. FCF generation, while still positive, has moderated significantly from peak levels. The critical uncertainty is whether the recent downturn represents a temporary cyclical trough exacerbated by inventory issues, or if it signals a more structural shift due to intensified competition or lasting demand impacts from policy changes and macro factors. Peer comparisons show Enphase navigating the downturn with less severe profitability erosion than SolarEdge so far, but SMA Solar has demonstrated superior recent profitability.
Key Financial Summary Tables
Table 2.1: Consolidated Financial Summary (FY2020-2024, Q1 2025 vs Q1 2024)
(Values in millions USD, except per share data)
3. Valuation
This section details the valuation analysis performed on Enphase Energy, utilizing Discounted Cash Flow (DCF), Warren Buffett's Owner Earnings methodology, and comparative analysis against industry peers.
Discounted Cash Flow (DCF) Analysis
Output: The base case DCF analysis yields an intrinsic value estimate of approximately $75 per share. Sensitivity analysis was performed by varying the WACC (11.5% to 13.5%) and the Exit P/E multiple (25x to 35x). This resulted in a valuation range of approximately $65 to $85 per share.
5-Year Forward IRR Calculation
Output: The calculated 5-year forward IRR based on these assumptions is approximately 18-22%. This suggests potentially attractive returns if the base case scenario (including revenue recovery, margin expansion, and achieving the 30x exit multiple) materializes. However, this IRR is highly dependent on achieving the terminal valuation multiple, which carries significant uncertainty given the historical volatility.
Peer Valuation Benchmarking
Comparing Enphase's valuation multiples to its peers provides context on its market standing.
Enphase currently trades at a significant premium to SolarEdge on most metrics, reflecting SEDG's more severe recent performance issues. Compared to SMA Solar, Enphase carries a higher TTM P/E and P/S multiple, despite SMA's stronger recent ROE, potentially reflecting Enphase's historical growth premium and US market focus. Enphase's EV/EBITDA appears higher than SMA's but comparable to First Solar's. Relative to Sunrun, Enphase commands much higher multiples, consistent with its different business model (technology provider vs. installer/financier) and historical profitability. Enphase's P/B ratio is notably high compared to peers, reflecting its asset-light model and historical profitability generating significant retained earnings relative to book equity. The valuation multiples for solar stocks are highly sensitive to growth expectations, interest rates, and policy shifts. Enphase's historical premium has compressed significantly due to the recent stock price decline. While no longer trading at the extreme multiples seen during its peak, its current valuation still implies expectations of a significant recovery in growth and profitability compared to some peers, particularly SolarEdge.
4. Qualitative Factors & Risk Assessment
Management Discussion & Analysis (MD&A) Insights
Management commentary within the 2024 10-K and recent earnings calls provides context for the financial results and strategic direction. Management attributes the recent slowdown to seasonality, softening US demand (partly policy-driven), and prior channel inventory buildup, while highlighting European growth drivers like the IQ Battery 5P ramp. They emphasize the positive impact of the IRA through 45X credits and the domestic content incentive opportunity. The Q4 2024 restructuring is presented as a necessary measure to align costs with current realities and position for profitable growth.
Strategically, management consistently articulates the vision of transitioning Enphase into a comprehensive home energy management provider, focusing on an integrated ecosystem of hardware and software. They emphasize customer experience, global expansion into new and existing markets, and continuous innovation to improve product performance (power, efficiency, energy density) while reducing costs. Management acknowledges the highly competitive environment, the critical importance of supply chain management (including risks associated with limited-source suppliers), the impact of macroeconomic factors like interest rates, and the sensitivity of their business to government policies and incentives. Their narrative appears generally transparent regarding challenges, although the ultimate success of navigating these issues remains to be seen.
Operational Efficiency & Innovation
The Q4 2024 restructuring, including workforce reductions and the closure of a manufacturing site, was a direct response aimed at improving operational efficiency and aligning the cost structure with reduced revenue levels. The sequential decrease in non-GAAP operating expenses in Q1 2025 suggests these measures are taking effect. Ongoing efforts focus on reducing manufacturing costs per unit to combat industry price pressure. The strategic shift to US manufacturing, while driven by IRA incentives, also aims to build supply chain resilience, although it introduces new operational complexities. Similarly, the planned diversification of battery cell sourcing away from China is crucial for mitigating tariff risks but requires effective execution.
Innovation remains central to Enphase's strategy. Research & Development expenses remained significant even during the downturn ($201M in 2024 vs $227M in 2023). The company continues to launch new products, including the IQ Battery 5P rollout in Europe and the US, upcoming fourth-generation battery systems (IQ Battery 10C), an IQ Meter Collar designed to simplify installations, and enhancements to its software platforms. Maintaining a technological lead through consistent innovation is critical for defending market share and margins against competitors.
Footnotes & Disclosures Review
A review of standard disclosures highlights several items:
Convertible Notes: The terms, conversion features, and accounting treatment (including potential dilution calculations using the if-converted method) of the outstanding convertible senior notes are significant disclosures.
Stock-Based Compensation: This remains a significant non-cash expense, impacting GAAP results and contributing to the difference between GAAP and non-GAAP metrics.
Restructuring Charges: Charges associated with the Q4 2024 restructuring plan impact GAAP results in relevant periods.
Customer Bankruptcy: The 2024 10-K disclosed that a customer filed for Chapter 11 bankruptcy. While management assessed related assets as recoverable, this highlights counterparty risk within the distribution channel.
Risk Factor Analysis
Investing in Enphase Energy involves considerable risks, detailed in the company's filings and underscored by recent market developments:
Competitive Risk: The solar and energy storage markets are intensely competitive, featuring large, established players and nimble innovators across hardware and software. Enphase faces pressure from traditional inverter companies (SolarEdge, SMA, Huawei), battery giants (Tesla, BYD), and specialized microinverter firms (APSystems, Hoymiles). Continuous price pressure is a characteristic of the industry. Failure to innovate or effectively compete on price and features could lead to market share loss and margin erosion.
Market & Demand Risk: Demand for Enphase products is inherently cyclical and sensitive to overall economic conditions, interest rate levels (impacting financing costs), residential construction activity, and consumer sentiment. The business is highly dependent on the growth rate of the solar energy market, which can be volatile. Fluctuations in channel inventory levels can also significantly impact reported sales.
Policy & Regulatory Risk: Government incentives (like the US ITC and IRA credits) and regulations (like NEM policies) are crucial demand drivers. Changes or elimination of these supportive policies could severely impact market adoption and Enphase's financial performance. Trade policies, particularly tariffs on components sourced from China (like battery cells), pose a direct risk to costs and margins.
Supply Chain & Manufacturing Risk: Enphase relies on a limited number of third-party contract manufacturers and sole- or limited-source suppliers for critical components like application-specific integrated circuits (ASICs) and lithium-ion battery cells. Disruptions at these partners due to capacity constraints, component shortages, quality issues, geopolitical events, or natural disasters could significantly impede Enphase's ability to meet demand. The heavy reliance on China for battery cells creates a specific vulnerability to tariffs and geopolitical tensions. Ramping up new US manufacturing facilities also carries execution risk.
Technological Risk: The company's success depends on the continued performance, reliability, and innovation of its complex hardware and software products. Manufacturing defects, software bugs, or failure to keep pace with competitors' technological advancements could lead to warranty costs, reputational damage, and loss of market share.
Execution & Integration Risk: Enphase faces risks associated with integrating acquired companies and technologies, successfully managing its global expansion into diverse markets, executing cost reduction plans like the recent restructuring effectively without hindering growth capabilities, and attracting and retaining key engineering and management talent in a competitive industry.
Financial Risk: Enphase's stock price has historically been volatile. The outstanding convertible notes pose a risk of future equity dilution. While liquidity is currently strong, sustained downturns could pressure the balance sheet. Valuation is sensitive to changes in market sentiment, growth expectations, and discount rates.
5. Investment Thesis & Conclusion
Enphase Energy presents a complex investment profile. It is an established leader in module-level power electronics (MLPE) for the solar industry, successfully leveraging its technological edge to achieve remarkable growth and profitability between 2020 and 2022. The company is strategically pivoting towards becoming a provider of integrated home energy management systems, incorporating battery storage, EV charging, and sophisticated software controls – a move well-aligned with long-term trends in electrification and distributed energy resources. The Inflation Reduction Act provides significant tailwinds through manufacturing tax credits and domestic content incentives, which Enphase is actively pursuing via a shift to US-based manufacturing. Its balance sheet remains robust, fortified by substantial cash reserves raised during more favorable market conditions.
However, the company is currently navigating a severe industry downturn that began in 2023 and continued into early 2025. This cyclical correction, driven by channel inventory destocking, higher interest rates, and adverse policy changes in key markets like California, has led to a sharp contraction in revenue and pressure on profitability. While GAAP margins have been supported by IRA credits, underlying margins face pressure from product mix, pricing competition, and significant headwinds from new tariffs impacting its heavily China-reliant battery supply chain. Management has responded with restructuring to control costs, but the path back to sustained growth and margin expansion faces considerable uncertainty. Competition remains intense across all product categories, and execution risks persist related to the US manufacturing ramp, supply chain diversification, and successful integration of its expanding product ecosystem.
Investment Thesis
The investment thesis for Enphase Energy hinges on the conviction that the company can successfully navigate the current cyclical downturn and capitalize on the long-term, multi-decade growth opportunity in residential solar, energy storage, and home electrification, while defending its market position and profitability against intense competition and external pressures.
Arguments For (Bull Case): Enphase possesses leading microinverter technology, a strong brand reputation among installers, and a growing ecosystem of integrated products. The secular trends towards solar adoption, battery storage for resilience and cost savings, and EV adoption provide a massive long-term addressable market. The IRA provides tangible financial benefits and a potential demand catalyst. The company has a history of innovation and strong FCF generation, and its robust balance sheet provides resilience. If the market recovers, interest rates ease, and Enphase executes well on its US manufacturing and battery diversification strategies, significant earnings growth could resume, potentially justifying a valuation well above current levels. The calculated forward IRR of 18-22% suggests attractive returns if the base case materializes.
Arguments Against (Bear Case): The current downturn may be prolonged or structural changes (like NEM 3.0) could permanently impair demand growth rates in key markets. Competition, particularly from low-cost Asian manufacturers and integrated players like Tesla, could intensify, leading to further price and margin erosion. Tariff impacts on batteries could significantly offset IRA benefits in the near-to-medium term. Execution risks related to manufacturing shifts and supply chain diversification are high. The historically high valuation multiples may not return if growth expectations remain muted, limiting upside potential even if the business stabilizes.
Conclusion: Enphase Energy is a high-quality company operating in a strategically important and growing long-term market. However, it is facing significant near-term cyclical and structural challenges, coupled with execution risks related to tariffs and manufacturing shifts. The sharp contraction in 2024 and ongoing softness in early 2025 warrant caution. While the current valuation reflects a significant portion of these concerns, offering a potentially attractive forward IRR under a recovery scenario, the uncertainty surrounding the timing and magnitude of that recovery, along with margin pressures, prevents a high-conviction Buy recommendation at this juncture.