


Qualys, Inc. (QLYS): Investment Analysis and Valuation

I. Executive Summary
Qualys, Inc. (NASDAQ: QLYS) is an established provider of cloud-based information technology (IT), security, and compliance solutions, with a long history rooted in vulnerability management (VM). The company operates a software-as-a-service (SaaS) model, generating recurring revenue primarily through annual subscriptions to its integrated Qualys Enterprise TruRisk Platform. Over the past five fiscal years (2020-2024), Qualys has demonstrated consistent profitability and robust free cash flow (FCF) generation, underpinned by high gross margins characteristic of its SaaS model. However, this period has also been marked by a noticeable deceleration in revenue growth, reflecting increasing competition, the maturity of its core VM market, and the challenges of scaling a larger revenue base.
Financially, Qualys achieved a 5-year revenue Compound Annual Growth Rate (CAGR) of approximately 12.1% from 2019 to 2024, though year-over-year growth slowed to 9.6% in 2024. Despite this slowdown, the company maintains strong profitability, with GAAP operating margins consistently above 20% in recent years (21.3% in 2021, 26.7% in 2022, 15.2% in 2023, 14.3% in 2024) and substantial FCF margins (averaging over 35% in the last three years). Capital allocation has heavily favored share repurchases, returning significant value to shareholders.
Competitively, Qualys remains a leader in the VM space but faces intense pressure from direct competitors like Tenable and Rapid7, as well as broader platform players such as Palo Alto Networks and CrowdStrike, who are increasingly encroaching on its core markets. Qualys' strategic response involves consolidating its offerings onto the integrated TruRisk platform and expanding into adjacent, higher-growth areas like cloud security (TotalCloud CNAPP) and endpoint detection and response (EDR), though traction in these areas against established leaders is crucial and still developing.
A Discounted Cash Flow (DCF) analysis, based on assumptions of moderating growth stabilizing in the mid-single digits and sustained high margins, yields an estimated intrinsic value range of $115 - $145 per share. Compared to the current market price (around $126.75 as of late April 2025), this suggests the stock is Fairly Valued. The investment thesis centers on Qualys as a stable, highly profitable cash generator within the cybersecurity sector, suitable for investors seeking exposure with moderate growth expectations. Key risks include intensifying competition impacting growth and pricing, failure to gain significant traction in new product areas, and potential challenges in executing its platform strategy. Potential catalysts include better-than-expected adoption of newer solutions or strategic M&A.
II. Qualys, Inc. - Company & Business Overview
Company Identification: Qualys, Inc., trading under the ticker QLYS on the NASDAQ Stock Market, is a provider of cloud-based IT, security, and compliance solutions. Founded in 1999 and headquartered in Foster City, California, Qualys established itself as a pioneer in the vulnerability management market.
Business Model: Qualys operates a Software-as-a-Service (SaaS) business model, delivering its solutions via the cloud. The cornerstone of this model is recurring revenue, generated predominantly through renewable annual subscriptions to its suite of cloud applications. Customers typically pay upfront for the subscription term, resulting in significant deferred revenue balances on the balance sheet, which are then recognized as revenue ratably over the subscription period. Revenue growth stems from two primary sources: acquiring new customers and, critically, expanding the relationship with the existing customer base by selling additional Cloud Apps hosted on the platform. This "land and expand" strategy is fundamental to Qualys' growth, making customer retention and the adoption rate of new modules essential performance indicators. The success of this model hinges on the perceived value and integration benefits of the platform encouraging customers to consolidate more of their security stack with Qualys.
Qualys Enterprise TruRisk Platform: The core of Qualys' offering is its Qualys Enterprise TruRisk Platform, a globally distributed, cloud-based architecture that underpins its entire suite of solutions. This platform is delivered from 14 shared cloud operations centers located across the United States, Europe, and Asia. Its design aims to provide customers with a centralized, unified view of their IT assets, security posture, and compliance status across complex and diverse environments, encompassing on-premises infrastructure, multiple public clouds (like AWS, Azure, GCP), endpoints, mobile devices, containers, operational technology (OT), and Internet of Things (IoT) devices. The platform leverages a large, continuously updated knowledge base of vulnerabilities and configuration checks, enabling automated assessment and management.
Primary Product Offerings (Qualys Cloud Apps): The TruRisk Platform hosts a comprehensive, integrated suite of applications:
Vulnerability Management, Detection and Response (VMDR): This flagship solution represents an evolution of traditional vulnerability management. VMDR provides automated asset discovery and inventory, continuous vulnerability scanning and assessment, risk-based prioritization using Qualys' TruRisk scoring (which incorporates threat intelligence and asset criticality), and integrated patch deployment capabilities to facilitate remediation. Its importance as a foundational element and key revenue driver is consistently emphasized.
Cloud Security (Qualys TotalCloud): Positioned as a Cloud-Native Application Protection Platform (CNAPP), TotalCloud integrates multiple cloud security functions. It offers visibility into multi-cloud assets, risk assessment, continuous monitoring, vulnerability detection across workloads (Cloud Workload Protection - CWP), threat detection and response (Cloud Detection and Response - CDR), and configuration monitoring (Cloud Security Posture Management - CSPM). This offering directly addresses the security challenges posed by rapid cloud adoption.
Compliance Solutions:
Policy Compliance (PC): Automates security configuration assessments against industry standards (e.g., CIS Benchmarks) and custom internal policies, aiding organizations in meeting regulatory requirements and internal governance mandates.
File Integrity Monitoring (FIM): Tracks changes to critical files on operating systems, providing alerts for potentially malicious activity or unauthorized modifications, often required for compliance standards like PCI DSS.
Asset Management:
Cybersecurity Asset Management (CSAM): Offers continuous discovery and inventory of all IT assets (known and unknown), including hardware, software, and cloud instances. It incorporates External Attack Surface Management (EASM) capabilities to identify internet-facing assets and potential exposures.
Risk Remediation:
Patch Management (PM): Automates the identification and deployment of patches for operating systems and third-party applications, directly correlating identified vulnerabilities with required patches.
Custom Assessment and Remediation (CAR): Allows security teams to create and deploy custom scripts for assessing unique configurations or remediating specific threats not covered by standard solutions.
Threat Detection and Response:
Multi-Vector Endpoint Detection and Response (EDR): Aims to provide comprehensive endpoint security by correlating various data points (asset information, vulnerabilities, endpoint activity telemetry) to detect and respond to complex attacks.
Other Solutions: The platform also includes Web Application Scanning (WAS) for web app and API security and free services like Global AssetView and Certificate Inventory.
The increasing breadth of these offerings reflects Qualys' strategic shift towards becoming a more comprehensive security platform. This move is necessary to counter the trend of "point solution fatigue" in the market and to compete more effectively with rivals offering broader security suites. The success of newer modules like TotalCloud and EDR in gaining market adoption is crucial for Qualys' future growth trajectory.
Revenue Sources & Segments: As noted, subscriptions constitute the primary revenue source. Qualys reports its financial results as one operating segment. However, it provides a geographic breakdown of revenues. For the fiscal year ended December 31, 2024, revenues were derived as follows: Americas (60%), Europe, Middle East and Africa (EMEA) (28%), and Asia Pacific (12%). This distribution has remained relatively consistent over the past few years. Sales are generated through a combination of direct sales forces (field sales for large enterprises, inside sales for SMBs) and a significant network of channel partners (including MSPs, VARs, and consultants), which accounted for approximately 40-42% of revenues in recent years.
Strategic Initiatives (Recent): Management commentary highlights a continued focus on platform consolidation under the TruRisk banner, emphasizing risk-based prioritization and integrated workflows across its various Cloud Apps. Significant R&D investment continues to be directed towards enhancing existing solutions and developing new capabilities, particularly in high-growth areas like cloud security and EDR.
III. Cybersecurity Industry Analysis & Competitive Positioning
Market Overview & Trends: The cybersecurity landscape is undergoing constant evolution, driven by several interconnected factors. The traditional network perimeter has dissolved due to the widespread adoption of hybrid and multi-cloud environments, the proliferation of remote workforces, and the increasing connectivity of IoT and OT systems. This expansion of the digital footprint creates a significantly larger and more complex attack surface for organizations to defend. Key trends shaping the market include:
Cloud Security Imperative: The migration of workloads and data to public clouds (AWS, Azure, GCP) necessitates specialized security solutions. Demand is surging for Cloud Native Application Protection Platforms (CNAPPs) that integrate capabilities like Cloud Security Posture Management (CSPM), Cloud Workload Protection (CWPP), and Cloud Infrastructure Entitlement Management (CIEM) to provide unified visibility and control across multi-cloud estates.
Vulnerability Management Evolution: The sheer volume of vulnerabilities makes patching everything impractical. Consequently, the focus has shifted from mere scanning to risk-based vulnerability management. This involves prioritizing vulnerabilities based on factors like exploitability, asset criticality, and potential business impact, aligning with Qualys' TruRisk approach. Integration with detection and response (VMDR) is also becoming standard.
Convergence towards XDR: The market is moving beyond siloed security tools like Endpoint Detection and Response (EDR). Extended Detection and Response (XDR) platforms aim to provide unified visibility, threat detection, investigation, and response across multiple security layers – including endpoints, cloud, networks, email, and identity – by correlating telemetry from these diverse sources.
Heightened Compliance Demands: Expanding regulatory frameworks globally (e.g., GDPR, CCPA) and increasing industry-specific mandates are driving the need for robust compliance monitoring and reporting solutions.
The AI Double-Edged Sword: Artificial Intelligence, particularly Generative AI (GenAI), is rapidly transforming cybersecurity. It offers significant potential for enhancing threat detection, automating response actions, and improving security operations efficiency. However, AI also introduces new risks, including sophisticated AI-powered attacks, the potential for data leakage from AI models, and the need to secure the AI development lifecycle itself.
Platform Consolidation: Faced with managing dozens of disparate security tools ("tool sprawl"), organizations are increasingly seeking to consolidate their security stack onto integrated platforms offered by fewer vendors. This trend favors providers with broad, well-integrated offerings.
Qualys' Market Position: Qualys is a long-standing and recognized player, particularly dominant in the Vulnerability Management market where it originated. Leveraging its strong VM foundation, Qualys has strategically expanded its platform to include adjacent capabilities like Cloud Security (TotalCloud CNAPP), Patch Management, Asset Management (CSAM/EASM), Compliance (PC/FIM), and EDR. Its integrated cloud platform is its core differentiator.
Key Competitors: Qualys operates in a highly competitive and fragmented market. Its key competitors include:
Direct VM/Exposure Management Rivals: Tenable (TENB) and Rapid7 (RPD).
EDR/XDR Leaders (expanding into VM/Cloud): CrowdStrike (CRWD) and SentinelOne (S).
Broad Security Platform Providers: Palo Alto Networks (PANW) and Microsoft.
Cloud-Native Security Specialists: Wiz, Orca Security.
Competitive Assessment:
Qualys vs. Tenable/Rapid7: This is the most direct comparison in the core VM/Exposure Management space. User reviews suggest Qualys is often perceived as having a strong integrated platform, being relatively cost-effective, and easy to deploy. Tenable is often praised for the depth of its vulnerability database and analytics, though potentially at a higher cost and complexity. Rapid7 is noted for its user-friendly interface and integration with its Insight platform (SIEM/SOAR) but can be resource-intensive. Financially, Qualys has historically maintained higher profitability margins than Tenable and Rapid7, but its revenue growth has often lagged, particularly Tenable's in recent years.
Qualys vs. CrowdStrike/SentinelOne: These competitors are leaders in the high-growth EDR/XDR market and command premium valuations. While they are expanding into VM and cloud security, potentially competing more directly with Qualys, their core strength and market perception lie in endpoint and threat response. Qualys' EDR offering faces a significant challenge in gaining traction against these established leaders. The stark difference in revenue growth rates (Qualys ~10% vs. CRWD ~25%, S ~30% YoY in recent periods) highlights the different market dynamics they operate in.
Qualys vs. Palo Alto Networks/Microsoft: These are large, diversified platform players with extensive resources and broad security portfolios encompassing network, cloud, endpoint, and identity. They represent a significant competitive threat through bundling and platform integration strategies. Qualys competes by offering a specialized, deeply integrated platform focused on risk assessment and remediation, potentially appealing to customers seeking best-of-breed capabilities within its domain or looking to consolidate specific functions.
Qualys' Advantages: Integrated cloud platform architecture, extensive vulnerability and configuration knowledge base, strong brand recognition in VM/compliance, large established customer base providing cross-selling opportunities.
Qualys' Disadvantages: Slower overall revenue growth compared to EDR/XDR and some cloud security peers, potentially perceived as lagging in innovation in faster-moving segments like XDR, significant competition from larger vendors with greater resources and bundling power.
The competitive environment necessitates Qualys' strategic shift towards a broader, integrated platform. Starting as a VM specialist, the company has added Cloud Security (TotalCloud CNAPP), Patch Management, EDR, and other modules onto its core platform. This evolution aims to address the market trend of platform consolidation and defend against competitors expanding from adjacent areas (like EDR players adding VM) or broad platforms bundling competing solutions. The success of this transition, particularly the adoption and effectiveness of newer offerings like TotalCloud and EDR, is paramount for Qualys to maintain relevance and stimulate growth against formidable competitors.
Furthermore, the rise of AI presents both an opportunity and a challenge. Qualys acquired Blue Hexagon to integrate AI/ML capabilities, aiming to enhance threat detection and risk prioritization. However, larger competitors like Microsoft, Palo Alto Networks, and CrowdStrike are investing heavily in AI across their broader platforms, potentially creating a capabilities gap if Qualys cannot keep pace due to resource constraints. Demonstrating tangible benefits and ROI from its AI investments will be crucial.
Strategic Shifts Over 5 Years: The past five years have seen Qualys evolve from primarily a VM and compliance vendor to a broader security platform provider. Key shifts include the launch and emphasis on VMDR as an integrated VM lifecycle solution, significant investment in cloud security culminating in the TotalCloud CNAPP offering (bolstered by the TotalCloud acquisition), entry into the EDR market, and the overarching branding and integration efforts under the Enterprise TruRisk Platform. These moves are direct responses to the market trends of platform consolidation, the rise of cloud computing, and the convergence of security disciplines.
IV. In-Depth Financial Analysis (FY 2020-2024)
A. Income Statement Analysis:
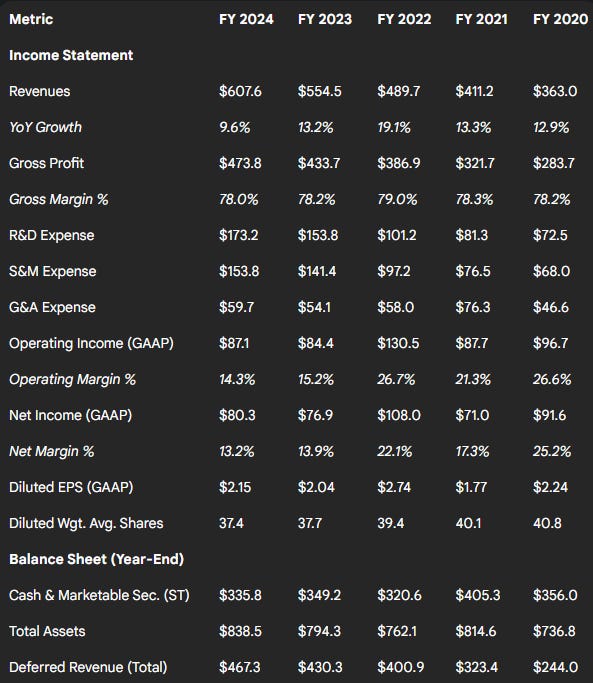
Revenue: Qualys has demonstrated consistent revenue growth over the past five years, increasing from $363.0 million in FY2020 to $607.6 million in FY2024. However, the rate of growth has decelerated markedly. YoY growth was 13.3% in FY2021, 19.1% in FY2022, 13.2% in FY2023, and slowed further to 9.6% in FY2024.3 The 5-year revenue CAGR from FY2019 ($321.6M 7) to FY2024 is approximately 12.1%. This slowdown likely reflects the maturity of the core VM market, intensifying competition, and the law of large numbers as the revenue base grows. Growth continues to be driven by both new customer acquisition and, significantly, the expansion of solutions within the existing customer base.
Gross Profit & Margin: Gross profit increased steadily from $283.7 million in FY2020 to $473.8 million in FY2024. Qualys maintains very high and stable gross profit margins, characteristic of an established SaaS business. The gross margin was 78.3% in FY2020, 78.3% in FY2021, 79.0% in FY2022, 78.2% in FY2023, and 78.0% in FY2024. This consistency reflects efficient delivery of its cloud platform.
Operating Expenses:
Research & Development (R&D): R&D expenses grew from $72.5 million (19.9% of revenue) in FY2020 to $173.2 million (28.5% of revenue) in FY2024. This significant increase, both in absolute terms and as a percentage of revenue, underscores the company's commitment to innovation and platform expansion to address the competitive landscape and evolving market needs.
Sales & Marketing (S&M): S&M expenses increased from $68.0 million (18.7% of revenue) in FY2020 to $153.8 million (25.3% of revenue) in FY2024. The rising S&M spend relative to revenue suggests increasing difficulty or cost in acquiring new customers or driving expansion in a competitive market, somewhat diminishing operating leverage from this function.
General & Administrative (G&A): G&A expenses grew from $46.6 million (12.8% of revenue) in FY2020 to $59.7 million (9.8% of revenue) in FY2024. G&A showed some leverage, declining as a percentage of revenue over the period, although FY2021 saw a spike ($76.3M or 18.6% of revenue) potentially related to stock-based compensation or other specific events. Stock-based compensation remains a significant component within operating expenses.
Operating Income & Margin: GAAP Operating Income grew from $96.7 million in FY2020 to a peak of $130.5 million in FY2022, before declining to $84.4 million in FY2023 and recovering slightly to $87.1 million in FY2024. The GAAP Operating Margin followed a similar pattern, peaking at 26.7% in FY2022, then decreasing to 15.2% in FY2023 and 14.3% in FY2024. This margin compression in the last two years, despite revenue growth, is primarily due to operating expenses (particularly R&D and S&M) growing faster than revenue, reflecting increased investments to drive future growth and compete effectively. While Qualys highlights strong Adjusted EBITDA margins (e.g., 47% in 2024), the GAAP figures show pressure from necessary investments.
Net Income & Margin: GAAP Net Income was $91.6 million in FY2020, $71.0 million in FY2021, $108.0 million in FY2022, $76.9 million in FY2023, and $80.3 million in FY2024. Net Income Margin was strong, ranging from 17.3% (FY2021) to 25.2% (FY2020), ending at 13.2% in FY2024. Fluctuations were driven by operating income trends, other income (primarily interest income on cash balances), and income tax provisions.
EPS (GAAP): Diluted EPS was $2.24 in FY2020, $1.77 in FY2021, $2.74 in FY2022, $2.04 in FY2023, and $2.15 in FY2024. EPS trends largely mirrored net income but were positively impacted by share count reduction through buybacks.
Weighted Average Shares: Diluted weighted average shares outstanding decreased from 40.8 million in FY2020 to 37.4 million in FY2024, reflecting the impact of the consistent share repurchase program.
B. Balance Sheet Analysis:
Asset Composition: Qualys maintains a strong and liquid balance sheet.
Cash & Marketable Securities: Total cash and marketable securities (short and long-term) remained substantial, ending FY2024 at $335.8 million ($217.5M cash + $118.3M short-term), although down from peaks in prior years due to significant share repurchases.
Accounts Receivable: Net Accounts Receivable grew broadly in line with revenue, ending FY2024 at $110.4 million. Days Sales Outstanding (DSO) appears stable.
PP&E: Property & Equipment (Net) increased modestly from $64.9 million in FY2020 to $103.5 million in FY2024, reflecting relatively low capital intensity.
Goodwill & Intangibles: These balances increased due to acquisitions like TotalCloud, Blue Hexagon, and Spell Security, ending FY2024 with $7.4M in Goodwill and $5.4M in Net Intangibles.
Total Assets: Grew from $736.8 million at YE2020 to $838.5 million at YE2024.
Liabilities & Equity:
Deferred Revenue: This is the largest liability, reflecting the subscription model. Total Deferred Revenue (Current + Non-Current) grew consistently from $244.0 million at YE2020 to $467.3 million at YE2024. The steady growth in this balance provides significant visibility into near-term revenue, but underscores the critical importance of maintaining high customer renewal rates. A slowdown in deferred revenue growth relative to recognized revenue could signal weakening bookings.
Debt: Qualys carries minimal to no financial debt.
Total Liabilities: Increased from $286.3 million at YE2020 to $570.9 million at YE2024, driven primarily by the growth in deferred revenue.
Shareholders' Equity: Ended FY2024 at $267.7 million, slightly down from $270.7 million at YE2023, and significantly impacted over the years by the interplay of net income and substantial share repurchases.
Liquidity Ratios: The Current Ratio (Current Assets / Current Liabilities) was 1.32x at YE2024 ($511.4M / $388.1M). The Quick Ratio (excluding less liquid current assets like prepaids) would be slightly lower but still indicates adequate short-term liquidity, supported by the strong cash balance.
Leverage Ratios: With minimal debt, leverage ratios like Debt-to-Equity are very low, indicating minimal financial risk.
C. Cash Flow Statement Analysis:
Operating Cash Flow (OCF): Qualys consistently generates strong OCF. OCF grew from $180.1 million in FY2020 to $243.8 million in FY2024. The OCF Margin (OCF/Revenue) has been robust, averaging well above 35% in recent years (e.g., 40.1% in FY2024, 38.7% in FY2023, 40.6% in FY2022, 48.8% in FY2021, 49.6% in FY2020). This highlights the company's excellent efficiency in converting profits into cash.
Capital Expenditures (CapEx): CapEx (Purchases of PP&E) has remained relatively low and stable, typical for a SaaS company whose primary assets are software and data centers (often leased or co-located). CapEx was $30.0 million in FY2020, $24.4 million in FY2021, $15.4 million in FY2022, $16.8 million in FY2023, and $17.7 million in FY2024. As a percentage of revenue, CapEx is consistently below 5%.
Free Cash Flow (FCF): Calculated as OCF minus CapEx, FCF generation is a key strength. FCF grew from $150.1 million in FY2020 to $226.1 million in FY2024. The FCF Margin (FCF/Revenue) is consistently high, exceeding 35% in most years (e.g., 37.2% in FY2024, 35.6% in FY2023, 37.5% in FY2022, 42.8% in FY2021, 41.4% in FY2020).
Use of FCF: The primary use of Qualys' substantial FCF has been share repurchases. The company executed significant buybacks each year: $126.7M in FY2020, $130.0M in FY2021, $317.3M in FY2022, $100.0M in FY2023, and $140.3M in FY2024. Over the five years, Qualys returned over $814 million to shareholders via buybacks. Cash was also used for small, tuck-in technology acquisitions ($1.2M in FY21, $8.6M in FY22). This capital allocation strategy, heavily favoring buybacks over larger M&A or potentially more aggressive R&D, reflects a mature company profile but raises questions about whether it's the optimal approach given the intense competitive pressures and the need for innovation highlighted in risk factors.
The overall financial picture is that of a mature, highly profitable, and cash-generative SaaS company. While top-line growth is slowing, the underlying business model remains efficient. The key financial challenge is balancing investment for future growth against maintaining high profitability and returning cash to shareholders, especially as competition intensifies.
Table 1: Qualys, Inc. 5-Year Financial Summary (FY2020-2024)
(Amounts in millions USD, except per share data)

V. Performance Metrics & Peer Valuation Analysis
Performance Ratios:
Return on Assets (ROA): Calculated as Net Income divided by Average Total Assets, ROA reflects how efficiently Qualys uses its assets to generate profit. Based on year-end asset values from Table 1, average assets were approximately $816M (FY24), $778M (FY23), $788M (FY22), $776M (FY21), and $696M (FY20). This yields ROA figures of roughly 9.8% (FY24), 9.9% (FY23), 13.7% (FY22), 9.2% (FY21), and 13.2% (FY20). Yahoo Finance reports a TTM ROA of 13.10%. The fluctuation reflects net income variability, but overall indicates reasonable asset efficiency, though declining in the last two years alongside operating margins.
Return on Equity (ROE): Calculated as Net Income divided by Average Stockholders' Equity, ROE measures profitability relative to shareholder investment. Average equity was approx. $269M (FY24), $265M (FY23), $332M (FY22), $427M (FY21), and $454M (FY20). This yields ROE figures of roughly 29.8% (FY24), 29.0% (FY23), 32.5% (FY22), 16.6% (FY21), and 20.2% (FY20). The calculated ROE shows strong returns, particularly benefiting from the low equity base (reduced by buybacks).
Valuation Ratios:
P/E Ratio (GAAP): Based on a recent price of ~$126.75 and FY2024 Diluted EPS of $2.15, the trailing P/E is approximately 59x. Forward P/E based on analyst consensus estimates for FY2025 EPS (~$5.83 ) is around 21.7x. Historically, the P/E ratio has varied significantly with market sentiment and growth expectations. The current forward P/E appears more moderate compared to historical trailing multiples during higher growth phases.
Price-to-Sales (P/S) Ratio: With a market cap of ~$4.61B and TTM Revenue of $607.6M, the current P/S ratio is approximately 7.6x. This is considerably lower than the ~13.7x seen at the end of 2023, reflecting the stock price decline and slowing growth.
EV/Sales Ratio: Enterprise Value (EV) is roughly Market Cap ($4.61B) - Net Cash (Cash + ST Mkt Sec - Debt ≈ $335.8M - negligible debt = $335.8M), resulting in an EV of ~$4.27B. The EV/Sales ratio is approximately 7.0x ($4.27B / $607.6M). Similar to P/S, this is down from levels above 12x at the end of 2023.
EV/EBITDA Ratio: Using the approximate EV of $4.27B and TTM EBITDA of $205.7M, the EV/EBITDA ratio is around 20.8x. This multiple has also compressed significantly from levels near 37x at the end of 2023.
Historical Context: Qualys' valuation multiples have compressed over the past 1-2 years as revenue growth decelerated from the high teens/low twenties into the high single digits/low double digits. The market appears to be re-rating the stock from a high-growth SaaS company to a more mature, moderate-growth profile.
Peer Comparison:
Table 2: Cybersecurity Peer Comparison (Data as of late April 2025)

Analysis: The peer comparison highlights Qualys' distinct profile.
Compared to direct VM competitors Tenable and Rapid7, Qualys exhibits similar or slightly lower recent growth but boasts significantly higher GAAP operating profitability and FCF margins. Its valuation multiples (P/S, EV/Sales) are higher than RPD's but significantly lower than its historical premium and closer to TENB's sales multiples, while its forward P/E is slightly higher than TENB/RPD, reflecting its earnings consistency.
Compared to high-growth CrowdStrike and SentinelOne, Qualys grows much slower but is solidly profitable on a GAAP basis and generates vastly superior FCF margins. CRWD and S command significantly higher sales multiples (P/S, EV/Sales) due to their rapid expansion, despite lower or negative GAAP profitability. Qualys trades at a substantial discount on sales multiples but a premium on forward P/E (vs. S, CRWD's P/E is extremely high).
Compared to Palo Alto Networks, Qualys is smaller and growing slower, but has comparable FCF margins. PANW, as a larger platform player, trades at higher sales multiples but a similar forward P/E range recently.
This relative positioning suggests the market values Qualys primarily for its profitability and cash flow, applying lower growth-based multiples (P/S, EV/Sales) compared to faster-growing peers, but a reasonable earnings multiple (Forward P/E) reflecting its stability. The discount to hyper-growth peers appears justified by the growth differential, while the premium over some slower or less profitable peers reflects its financial strength. The core valuation question is whether the current multiples adequately capture the balance between its mature stability and the competitive risks to future growth.
VI. Qualitative Insights from Annual Filings (MD&A, Risks, Footnotes)
Management Discussion & Analysis (MD&A) Synthesis: Across the MD&A sections of the 10-K filings from FY2020 to FY2024, management consistently points to the adoption of the Qualys Cloud Platform and its integrated solutions as the primary driver of revenue growth. Both attracting new customers and, crucially, expanding the footprint within the existing customer base by selling additional Cloud Apps are highlighted year after year. Strategic initiatives evolved, initially focusing on enhancing core VM capabilities, then launching and promoting VMDR, followed by a greater emphasis on cloud security through acquisitions (TotalCloud in FY21, Blue Hexagon in FY22) and the development of the TotalCloud CNAPP offering. The entry into EDR was also noted as a strategic expansion. The overarching strategy centers on the integrated "TruRisk Platform" to provide a unified view of risk and streamline security operations for customers. Management acknowledges the highly competitive market and the need for continuous innovation, justifying significant R&D investments. The importance of channel partners as a key go-to-market route is also consistently mentioned.
Risk Factors Summary: The Risk Factors sections across the filings paint a consistent picture of the challenges Qualys faces:
Competition: This is a dominant theme. Risks include intense competition from numerous vendors, including those with greater resources, brand recognition, and the ability to bundle products or compete aggressively on price. The failure to compete effectively could lead to price reductions, reduced margins, and loss of market share.
Innovation & Market Adaptation: The need to successfully anticipate market needs, enhance existing solutions (like VMDR, TotalCloud), and develop new ones in a rapidly evolving technological landscape is critical. Failure to innovate or adapt could harm competitiveness.
Platform Performance & Security: Risks related to the performance, scalability, and reliability of the Qualys Cloud Platform are significant, as any disruption could impact service delivery. Furthermore, Qualys itself is a target for security breaches, which could damage its reputation and result in liability. Undetected errors in its software could also harm reputation and decrease market acceptance.
Sales & Execution: Long and unpredictable sales cycles, the effectiveness of the sales force and channel partners, and the ability to manage growth effectively are key execution risks. Reliance on channel partners for a significant portion of revenue introduces dependency risk.
Data Privacy & Compliance: Handling customer data, including potentially sensitive personal information, exposes Qualys to risks related to privacy regulations and data handling concerns.
Intellectual Property: Protecting proprietary technology and avoiding infringement claims from third parties are ongoing risks. Use of open-source software also carries licensing compliance risks.
The consistent emphasis in Risk Factors on intense competition and the need for continuous innovation, when viewed alongside the MD&A's focus on platform expansion and R&D investment, clearly signals the pressure Qualys faces. The company must successfully evolve its platform and product suite to defend its established position and capture growth in newer segments against well-funded and agile competitors. Failure in this strategic evolution represents a primary risk.
Footnotes Review:
Revenue Recognition: The policy of recognizing subscription revenue ratably over the contract term remained consistent, aligning with standard SaaS practices.
Acquisitions: Footnotes detail several tuck-in acquisitions aimed at bolstering specific capabilities: Adya (SaaS management, FY19), Spell Security (EDR, FY20), TotalCloud (Cloud Security, FY21, $1.2M), and Blue Hexagon (AI/ML, FY22, $8.6M). These reflect the strategy of adding technology and talent through targeted M&A rather than large, transformative deals.
Stock-Based Compensation (SBC): SBC is a material expense, impacting GAAP profitability. Fluctuations in annual SBC expense (e.g., higher in FY21 vs. FY22) can affect comparability and margin analysis. The use of performance-based units (PSUs) adds variability.
Segment Information: Consistently reported as one operating segment, with geographic revenue disclosures confirming the Americas as the largest region, followed by EMEA and APAC.
Share Repurchase Program: Footnotes confirm the authorization and execution of significant share repurchase programs, detailing amounts spent and shares repurchased annually. This highlights the major use of cash flow for capital return.
The substantial and continuous share repurchase program, detailed in the cash flow statements and footnotes, represents a significant capital allocation decision. While benefiting shareholders through share count reduction and EPS support, it consumes capital that could potentially fund larger acquisitions or more aggressive R&D efforts needed to directly counter the competitive threats outlined in the Risk Factors. This strategic choice warrants consideration when evaluating the company's long-term growth prospects versus its commitment to shareholder returns.
VII. Synthesis: Overall Financial Health & Operational Assessment
Financial Health Assessment: Qualys exhibits robust financial health characterized by:
Strengths: Consistent and strong GAAP profitability (positive operating and net income over the 5-year period), high and stable gross margins (~78-80%), substantial operating and free cash flow generation with strong margins (OCF & FCF margins often >35%), a healthy balance sheet with significant cash and marketable securities and minimal debt, and a consistent track record of returning capital to shareholders via large share repurchases.
Weaknesses/Concerns: The primary concern is the clear trend of decelerating revenue growth, falling below 10% in FY2024. This growth rate lags significantly behind key high-growth cybersecurity peers, particularly those in the EDR/XDR and cloud-native security spaces. Operating margin compression in FY23 and FY24 also indicates rising investment needs relative to growth.
Operational Performance Assessment: Qualys' operational performance presents a mixed picture. The "land and expand" model appears functional, given that revenue growth consistently relies on expansion within the existing base. The high deferred revenue balance also suggests healthy bookings and renewals. However, the slowing overall growth rate suggests challenges in either accelerating the "expand" motion or in acquiring new customers at a sufficient pace. The strategic shift towards an integrated platform (TruRisk) and expansion into Cloud Security and EDR is operationally critical but requires flawless execution against entrenched competitors. While R&D spending has increased significantly as a percentage of revenue, indicating investment, the simultaneous increase in S&M spending relative to revenue suggests potential inefficiencies or increasing difficulty in driving growth.
Competitive Advantages & Disadvantages:
Advantages: Deep expertise and strong brand in VM/compliance; integrated platform architecture facilitating cross-selling and potential customer consolidation; extensive vulnerability database; large, established enterprise customer base.
Disadvantages: Slower growth profile limits appeal to growth-focused investors; perceived as less dynamic or innovative compared to EDR/XDR leaders; faces significant competition from larger platforms offering bundled solutions and aggressive pricing; potential challenges in gaining significant share in crowded markets like Cloud Security and EDR.
Growth Sustainability: Re-accelerating growth appears challenging. Sustainability likely depends on successfully leveraging the integrated platform to drive deeper penetration within the existing customer base and achieving meaningful adoption of newer solutions like TotalCloud and EDR. The core VM market is relatively mature, making significant growth acceleration dependent on success in these adjacent, more competitive arenas. Mid-to-high single-digit growth seems more plausible than a return to sustained double-digit growth without significant strategic shifts or M&A.
Overall, Qualys appears to be navigating the transition from a high-growth niche leader to a more mature, broader platform player. Its financial strength provides stability and resources, but the operational challenge lies in balancing sustained profitability and capital returns with the necessary investments in innovation and market expansion to remain competitive and relevant in the rapidly evolving cybersecurity landscape. The company's ability to effectively execute its platform strategy against larger, faster-moving competitors will determine its long-term trajectory.
VIII. Future Outlook & Intrinsic Valuation
A. Forward-Looking Assumptions & Projections: Based on historical trends, industry dynamics, and competitive positioning, the following assumptions underpin the valuation forecast:
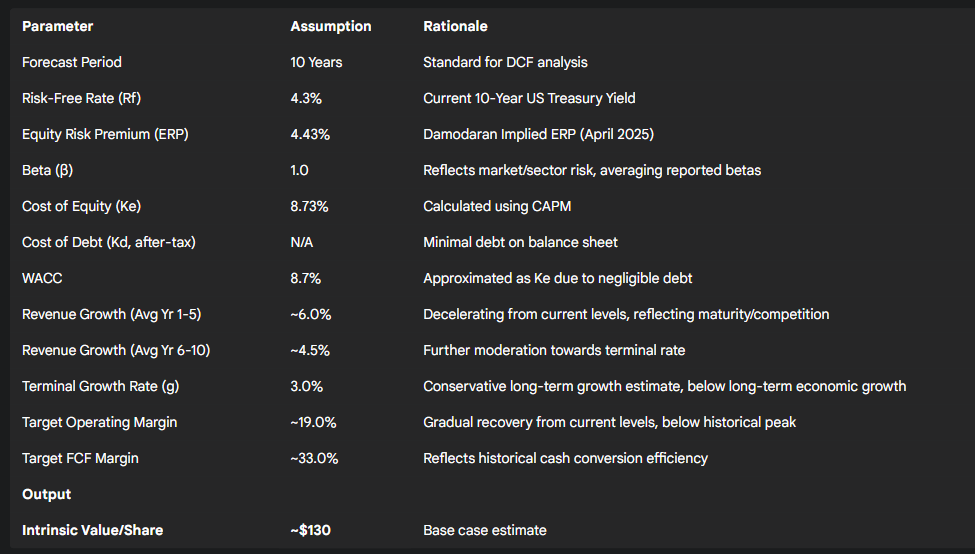
Revenue Growth: Assumed to continue decelerating from the 9.6% in FY2024, potentially averaging 7-8% over the next two years, then gradually declining towards a terminal growth rate. A 5-year average growth rate of ~6% is assumed, stabilizing at a 3.0% perpetual growth rate thereafter. This reflects market maturity in VM, intense competition, and moderate success in platform expansion.
Margins: Gross margins are assumed stable at ~78%, consistent with historical performance. GAAP Operating Margins are projected to gradually recover from the current 14.3% towards 18-20% over the medium term as investment growth potentially moderates relative to revenue, but unlikely to reach the peak levels seen in FY22 due to sustained competitive R&D needs. FCF margins are expected to remain strong, likely in the 30-35% range, reflecting low CapEx and efficient cash conversion.
Taxes: An effective tax rate of ~19-20% is assumed, based on recent historical rates.
CapEx: Projected to remain low, around 3-4% of revenue, consistent with historical levels and the SaaS model.
Working Capital: Changes projected based on historical relationships with revenue growth, particularly considering deferred revenue dynamics.
B. Discounted Cash Flow (DCF) Model & Intrinsic Value Estimation: A 10-year, two-stage DCF model was constructed based on Free Cash Flow to the Firm (FCFF).
WACC Calculation:
Risk-Free Rate (Rf): 4.3% (based on current 10-Year US Treasury Yield).
Equity Risk Premium (ERP): 4.43% (based on Damodaran April 1, 2025 estimate).
Beta (β): 1.0 (Averaging reported betas ranging from 0.71 to 1.20 and reflecting market/sector risk).
Cost of Equity (Ke) = 4.3%+1.0∗4.43%=8.73%.
Cost of Debt (Kd): Assumed negligible due to minimal debt.
WACC: Approximated as the Cost of Equity, resulting in a WACC of 8.7%.
Terminal Value: Calculated using the Gordon Growth Model with a perpetual growth rate (g) of 3.0%.
Intrinsic Value: Discounting the projected FCFFs and Terminal Value at the 8.7% WACC yields an estimated Equity Value per Share of approximately $130.
C. Sensitivity Analysis: The intrinsic value is sensitive to changes in WACC and the terminal growth rate assumptions.
A 0.5% increase/decrease in WACC (to 9.2%/8.2%) results in a value range of ~$118 - $145.
A 0.5% increase/decrease in the terminal growth rate (to 3.5%/2.5%) results in a value range of ~$141 - $121.
Combining these sensitivities suggests a plausible intrinsic value range of $115 - $145 per share.
Table 3: DCF Model Summary & Key Assumptions
D. 5-Year Forward Internal Rate of Return (IRR) Calculation: Assuming a purchase at the current price of ~$126.75 and holding for 5 years, with an exit value based on the DCF-implied value at Year 5 (or a reasonable exit multiple like ~18-20x FCF), the projected IRR is estimated to be in the 8-10% range. This suggests moderate potential returns, roughly in line with the estimated cost of equity.
The valuation suggests that Qualys is currently trading near its estimated intrinsic value, assuming moderate future growth and sustained profitability. Significant upside would likely require either a re-acceleration of revenue growth (driven by success in cloud/EDR markets) or substantial margin expansion beyond current projections, neither of which appears highly probable in the base case given competitive dynamics.
IX. Investment Thesis & Conclusion
Valuation Summary: Based on the DCF analysis yielding an intrinsic value range of $115 - $145 per share (base case ~$130), and considering the current market price of approximately $126.75, Qualys stock appears Fairly Valued. Relative valuation metrics (P/S, EV/Sales) place it below hyper-growth peers but reasonably valued considering its superior profitability and FCF generation compared to direct VM competitors.
Investment Thesis: Qualys represents a financially robust, mature player in the cybersecurity landscape, anchored by its leadership in the Vulnerability Management market. The company consistently generates substantial profits and free cash flow, which it diligently returns to shareholders via share repurchases. Its integrated TruRisk platform offers potential for customer consolidation and efficiency gains. However, the company faces significant headwinds from decelerating revenue growth and intense competition across its core and expansion markets (Cloud Security, EDR) from both specialized players and large platform vendors. While strategic initiatives aim to address these challenges, a significant re-acceleration of growth appears difficult. The current valuation seems to appropriately balance Qualys' strong financial profile and cash generation capabilities against its moderate growth outlook and competitive risks. Therefore, the recommended investment thesis is Hold. Qualys offers stable exposure to the cybersecurity sector with strong cash returns, but lacks the significant upside potential associated with higher-growth peers.
Key Risks to Thesis:
Competitive Pressure: Intensifying competition from Tenable, Rapid7, CrowdStrike, Palo Alto Networks, Microsoft, and cloud-native startups could lead to further market share erosion, pricing pressure, and margin compression, particularly if Qualys fails to differentiate its platform effectively.
Execution on Platform Strategy: Failure to gain significant traction with newer solutions (TotalCloud CNAPP, EDR, Patch Management) and successfully cross-sell them into the existing customer base could result in growth stagnating below expectations.
Innovation Lag: Inability to keep pace with rapid technological advancements, particularly in AI-driven security and XDR capabilities, compared to better-resourced competitors could diminish Qualys' long-term value proposition.
Macroeconomic Downturn: A significant economic slowdown could impact IT budgets, potentially lengthening sales cycles and reducing customer spending on security solutions.
Potential Catalysts:
Successful Platform Adoption: Stronger-than-anticipated customer adoption of the integrated TruRisk platform and newer modules like TotalCloud or EDR, leading to growth re-acceleration.
Margin Expansion: Better-than-expected cost control or operating leverage leading to margin expansion beyond projections, boosting FCF and valuation.
Strategic M&A: Acquisition of a complementary technology or company that meaningfully accelerates growth or enhances competitive positioning in a key market segment.
Increased Buybacks/Dividends: Further enhancement of capital return programs could increase appeal to value/income investors.
Concluding Remarks: Qualys is a well-managed, highly profitable cybersecurity company with a strong foundation in vulnerability management. Its transition towards a broader, integrated security platform is strategically necessary but faces significant execution and competitive challenges. While its financial stability and cash generation are commendable, the decelerating growth profile limits its upside potential. At its current valuation, the stock appears fairly priced, reflecting its status as a mature, stable cash generator within a dynamic industry. A Hold rating is appropriate until there is clearer evidence of successful platform expansion translating into re-accelerated growth or a more compelling valuation entry point emerges.