


Smart Claims, Smarter Investment? A Look at CCC Intelligent Solutions (CCCS)
Buy

I. Summary
A. Synopsis:
CCC Intelligent Solutions Holdings Inc. (CCCS) has demonstrated consistent revenue growth over the past five fiscal years (FY2020-FY2024), with this trend continuing into the first quarter of FY2025. Revenue increased from $633.1 million in FY2020 to $944.8 million in FY2024, and Q1 2025 revenue reached $251.6 million, up 10.7% year-over-year. Adjusted EBITDA has also shown robust growth, reaching $397.4 million in FY2024 from $202.8 million in FY2020, with Q1 2025 adjusted EBITDA at $99.1 million. However, GAAP net income has been volatile, impacted by significant stock-based compensation following its 2021 SPAC merger and a goodwill impairment charge in FY2023 related to its China unit. The company maintains strong free cash flow generation, reaching $230.9 million in FY2024 and $43.6 million in Q1 2025. Key strengths include its dominant market position in the P&C insurance technology sector, a deeply embedded SaaS platform with high customer retention (99% software gross dollar retention), and expanding AI capabilities, further enhanced by the recent acquisition of EvolutionIQ. Current challenges include macroeconomic headwinds leading to a decline in auto physical damage (APD) claim volumes and the financial impact of integrating acquisitions.
B. Overall Assessment of CCCS:
The company exhibits improving financial health, primarily evidenced by strong revenue growth, consistent adjusted EBITDA margin expansion (reaching 42% in FY2024 and guided to 40% for FY2025 including EvolutionIQ dilution), and robust free cash flow. Operational efficiency, viewed through adjusted metrics, is strong, though GAAP profitability needs to demonstrate sustained improvement. Growth appears sustainable, driven by the ongoing digitization of the P&C insurance economy, the adoption of AI-powered solutions, and strategic expansion into adjacent markets like casualty claims.
C. Investment Thesis and Core Recommendation:
CCC Intelligent Solutions operates a resilient and highly-integrated SaaS business model with strong competitive advantages in the North American P&C insurance ecosystem. Its consistent revenue growth, expanding adjusted profitability, and strong free cash flow generation are indicative of a fundamentally sound business. The strategic acquisition of EvolutionIQ opens new avenues for growth in the casualty segment, aligning with industry needs for advanced AI solutions. While near-term headwinds from APD claim volumes and the dilutive impact of acquisitions present modest challenges, the long-term tailwinds of digital transformation and AI adoption in the insurance industry provide a substantial runway for growth. The current valuation, when assessed through a discounted cash flow lens and relative to its growth prospects and FCF generation, suggests potential upside. Therefore, the investment thesis is cautiously optimistic, leaning towards a favorable long-term outlook. A BUY recommendation is issued, with the understanding that investors should monitor the successful integration of EvolutionIQ, the trajectory of claim volumes, and the path to sustained GAAP profitability.
II. Company and Industry Context
A. Business Overview:
1. Business Model:
CCC Intelligent Solutions Holdings Inc. (CCCS) operates as a premier Software-as-a-Service (SaaS) platform provider, deeply embedded within the multi-trillion-dollar Property & Casualty (P&C) insurance economy. The company's core offering is the CCC Intelligent Experience (IX) Cloud™ platform. This platform is engineered to digitize and automate mission-critical workflows using artificial intelligence (AI), facilitate commerce, and seamlessly connect a vast and diverse network of businesses integral to the insurance ecosystem.
The CCC IX Cloud™ serves as a central hub, linking insurers, collision repair facilities, automotive original equipment manufacturers (OEMs), parts suppliers, lenders, and various other participants. By fostering this interconnected ecosystem, CCCS enables more efficient communication, streamlined processes, and data-driven decision-making. The business model emphasizes deep integration into the daily operations of its customers, which cultivates strong, long-term relationships and contributes to exceptionally high customer retention rates, a hallmark of its market strength.
2. Primary Revenue Sources:
The substantial majority of CCCS's revenue is derived from software subscriptions, granting customers access to its comprehensive platform and diverse suite of solutions. This recurring revenue model provides a high degree of predictability to its financial performance. Beyond software subscriptions, the company also generates revenue from professional services, which may include implementation, training, and consulting, as well as other non-software services.
CCCS's growth strategy is multi-faceted, focusing on acquiring new customers (new logos), enhancing revenue from its existing customer base through cross-selling additional modules and upselling to premium solutions, and strategically expanding into adjacent market segments and new geographies.
3. Key Operational Segments:
Historically, CCCS has operated and reported as a single operational segment, focusing on its domestic SaaS platform for the P&C insurance economy. The primary customer groups served by this platform are:
Insurance Carriers: CCCS boasts over 300 insurers on its network, including many of the largest carriers in the United States. These clients utilize CCCS solutions for claims processing, underwriting support, and fraud detection, among other functions.
Collision Repair Facilities: The network includes over 30,500 automotive collision repair facilities. This represents an increase from approximately 28,000-29,500 in prior periods, indicating continued network expansion. These facilities rely on CCCS for estimating, repair management, parts procurement, and customer communication.
Automotive OEMs: CCCS maintains relationships with 12 to 13 of the top 15 automotive OEMs based on new vehicle sales. These partnerships often involve data exchange and integration to support repair processes and vehicle safety.
Parts Suppliers: More than 5,000 to 5,500 parts suppliers are connected to the CCC network, facilitating electronic parts ordering and streamlining the parts procurement workflow.
B. P&C Insurance Technology Industry Landscape:
1. Industry Trends:
The P&C insurance technology landscape is characterized by several transformative trends:
Accelerated Digital Transformation: The P&C insurance sector, a multi-trillion-dollar global industry, is in the midst of a significant, generational shift towards digitalization. Legacy systems and manual processes are increasingly being replaced by cloud-native, AI-driven workflows to enhance efficiency, reduce costs, and improve customer experiences. CCCS is strategically positioned as a key enabler of this digital evolution.
Pervasive AI and Advanced Analytics: Artificial intelligence, including generative AI and predictive modeling, is fundamentally reshaping the insurance value chain. These technologies are being deployed for sophisticated risk assessment, more accurate underwriting, streamlined claims processing (including automated damage detection, claim triage, AI-assisted estimating, and advanced fraud detection), and personalized customer service interactions. CCCS has made substantial investments in AI, integrating it across its solution suite.
Cloud Dominance: The migration of core insurance platforms, such as claims management and policy administration systems, to the cloud is a dominant trend. Cloud adoption offers insurers enhanced scalability, greater agility in launching new products, and potential for operational cost reductions. CCCS's SaaS-native platform directly aligns with and benefits from this industry-wide shift.
Impact of IoT and Connected Devices: The proliferation of Internet of Things (IoT) devices, including vehicle telematics, smart home sensors, and wearables, is providing insurers with unprecedented volumes of real-time data. This data is transforming risk assessment, enabling the development of usage-based insurance (UBI) products, and facilitating proactive risk mitigation strategies.
Elevated Focus on Customer Experience: In a competitive market, insurers are increasingly prioritizing the delivery of seamless, intuitive, and personalized digital experiences to meet the evolving expectations of modern policyholders and to improve customer retention.
Navigating Increasing Complexity: The P&C insurance industry is grappling with a confluence of factors that are escalating operational complexity. These include the rapid advancements in vehicle technology (such as Advanced Driver-Assistance Systems (ADAS) and Electric Vehicles (EVs), persistent supply chain disruptions, shortages of skilled labor, inflationary pressures (encompassing social inflation, medical cost inflation, and rising repair costs), and an evolving regulatory landscape.
2. Growth Drivers for the Market:
The demand for P&C insurance technology is fueled by several key drivers:
The imperative for insurers and repairers to achieve greater operational efficiency and cost reduction, particularly in the claims handling process, which is often a significant expense area.
The increasing expectation for faster, more accurate claims processing and a significantly improved customer satisfaction journey throughout the claims lifecycle.
The exponential growth in data availability from various sources, coupled with the critical need for sophisticated tools and platforms to analyze this data and derive actionable insights for better decision-making.
The auto collision estimating software market itself is projected to experience robust growth, with some forecasts indicating a Compound Annual Growth Rate (CAGR) in the range of 10.4% to 12.8%. This growth is propelled by factors such as rising road accident rates globally and the continuous integration of advanced technologies into vehicles and repair processes. Similarly, the broader claims management market is anticipated to expand significantly, with a projected CAGR of 13.3%, driven by the push for digitization and automation.
C. Competitive Positioning:
1. Key Competitors:
In the P&C insurance technology landscape, particularly within the auto physical damage (APD) claims ecosystem, CCCS faces competition from a few key players. The most direct and significant competitors are Mitchell International (now part of Enlyte) and Solera Holdings. These companies offer similar, though differentiated, comprehensive platforms and network solutions for the APD claims process. The market for auto repair shop management software is broader, including companies like Alldata (a subsidiary of AutoZone), Tekmetric, and Shopmonkey, which primarily cater to the operational needs of repair facilities and may have some overlapping functionalities at the repairer end.
While larger enterprise software vendors such as SAP, and data management specialists like Precisely and Ab Initio, operate in adjacent or related technology sectors, they do not typically offer the specialized, end-to-end claims processing solutions that form the core business of CCCS and its direct competitors. The competitive landscape for comprehensive P&C claims platforms that connect insurers, repairers, OEMs, and parts suppliers is relatively concentrated, with CCCS, Mitchell, and Solera forming what can be described as a near oligopoly in the North American market. Their entrenched positions are largely due to the extensive networks they have built over decades and the deep integration of their software into the critical workflows of both insurers and collision repairers.
2. CCCS Market Share and Advantages:
While precise, independently verified market share figures are often proprietary, some industry estimates suggest CCCS holds a significant share, with one source indicating approximately 35% in its core market. This figure should be viewed as an estimate, but it underscores the company's strong market presence.
CCCS's competitive advantages are rooted in several key areas:
Comprehensive Integrated Platform: The CCC ONE™ platform offers an end-to-end suite of solutions that manage the entire claims and repair lifecycle.
Extensive Multi-Sided Network: CCCS has cultivated a vast network connecting over 35,000 businesses, including insurers, repair facilities, OEMs, and parts suppliers. This network effect creates significant barriers to entry and a sticky customer base, as the value of the platform increases with the number of participants.
Deep Data Assets: The company has processed over $1 trillion in historical claims and repair data, creating proprietary data assets that fuel its AI models and provide unique insights to its customers.
Proven AI Capabilities: CCCS has been a pioneer in applying AI to the claims process, with solutions for damage detection, estimate STP (Straight-Through Processing), subrogation, and more. These AI capabilities are a key differentiator and value driver for customers.
Strong Customer Loyalty: High software gross dollar retention rates, consistently around 99%, and industry-leading Net Promoter Scores (NPS) are indicative of strong customer satisfaction and the mission-critical nature of its solutions.
D. Significant Strategic Developments and Market Dynamics:
The period from FY2020 through Q1 2025 has been transformative for CCCS, marked by significant strategic initiatives and responses to evolving market dynamics.
1. Initial Public Offering (IPO): A pivotal event was CCCS going public in July 2021 through a merger with Dragoneer Growth Opportunities Corp., a Special Purpose Acquisition Company (SPAC). This transaction provided CCCS with significant capital to fuel its growth strategies, invest in innovation, and expand its market reach. The transition to a publicly traded company also brought increased visibility and access to public capital markets.
2. Acquisition of EvolutionIQ: In late 2024, with the transaction completed in the first quarter of 2025, CCCS acquired EvolutionIQ, a company specializing in AI-powered guidance for disability and injury claims management. This strategic acquisition is aimed at expanding CCCS's footprint into adjacent insurance lines, specifically disability and workers' compensation, which represent large addressable markets. EvolutionIQ's technology, including capabilities like Medical Summarization and Next Best Action recommendations, is expected to significantly enhance CCCS's existing AI platform and offerings in the complex casualty claims space. Financially, EvolutionIQ is projected to contribute approximately $45 million to $50 million in revenue during FY2025, though it is expected to have a moderately dilutive effect on EBITDA in the near term as integration and growth investments are made. The acquisition has already shown an impact on Net Dollar Retention (NDR), contributing nearly two percentage points in Q1 2025. Management has highlighted the casualty sector as a significant growth opportunity, potentially rivaling or exceeding its current auto physical damage business in size over time. The planned launch of "Medhub for Casualty" in Q3 2025, leveraging EvolutionIQ's technology, underscores the rapid integration efforts.
3. Market Dynamics & Significant Events (from MD&A):
COVID-19 Pandemic Impact: The early part of the analysis period was shaped by the COVID-19 pandemic, which initially caused disruptions in driving patterns and claims frequency. However, the pandemic also served as a catalyst, accelerating the insurance industry's adoption of digital tools and remote processing capabilities, a trend that benefited CCCS's SaaS offerings.
Macroeconomic Headwinds: More recently, the macroeconomic environment has introduced new challenges. Rising inflation, increased interest rates, and heightened consumer economic sensitivity have contributed to a noticeable decline in filed auto physical damage (APD) claim volumes. In Q1 2025, APD claims were reported to be down 9% year-over-year. This trend is attributed to consumers raising deductibles, reducing insurance coverage, or opting to self-pay for minor damages to avoid premium increases. Management anticipates this pressure on claim volumes to persist through 2025.
Supply Chain and Inflationary Pressures: Persistent supply chain disruptions for automotive parts and broad inflationary pressures have impacted vehicle repair costs, parts availability, and overall vehicle values. These factors have increased the complexity and cost of claims handling for insurers and repairers, further highlighting the need for efficient digital solutions.
Goodwill Impairment (FY2023): In fiscal year 2023, CCCS recognized a non-cash goodwill and intangible asset impairment charge of $82.7 million. This charge was specifically related to the company's China reporting unit and was a primary contributor to the reported net loss for that year. This event suggests a re-evaluation of the company's strategic approach or market conditions in that specific international market.
Share Repurchase Program: The company's Board of Directors authorized a share repurchase program of up to $300 million. During the first quarter of 2025, CCCS acted on this authorization by repurchasing 7 million shares of its common stock for a total of $72 million. Such programs can indicate management's belief that the company's stock is undervalued and can be a means of returning capital to shareholders or offsetting dilution from stock-based compensation.
III. In-Depth Financial Performance Analysis
This section delves into the financial statements of CCC Intelligent Solutions Holdings Inc. over the last five fiscal years (2020-2024) and the first quarter of 2025, providing a comprehensive assessment of its performance trajectory.
A. Income Statement Deep Dive:
1. Revenue Trends:
CCCS has demonstrated consistent and robust revenue growth. Total revenue grew from $633.1 million in FY2020 to $944.8 million in FY2024, representing a compound annual growth rate (CAGR) of approximately 10.5%. The year-over-year (YoY) growth figures are as follows:
FY2020: $633.1 million
FY2021: $688.3 million (8.7% growth). Adjusted for the divestiture of a portion of the professional services casualty solution (First Party Clinical Services) in December 2020, the adjusted revenue growth was higher, at 15% for FY2021.
FY2022: $782.4 million (13.7% growth)
FY2023: $866.4 million (10.7% growth)
FY2024: $944.8 million (9.1% growth)
In the first quarter of FY2025, total revenue was $251.6 million, an increase of 10.7% compared to $227.2 million in Q1 2024. This growth exceeded management's guidance and marked the first time the company surpassed a $1 billion revenue run rate.
The primary drivers of this revenue growth include the acquisition of new customers (particularly repair facilities and parts suppliers), successful cross-selling of additional solutions to the existing customer base, upselling to higher-value product tiers, and the increasing adoption of new and emerging solutions. For instance, in Q1 2025, emerging solutions contributed approximately two percentage points to revenue growth. The acquisition of EvolutionIQ is also a significant factor, contributing nearly four percentage points to the Q1 2025 growth and is expected to add $45-50 million to FY2025 revenue.
Despite the overall positive trend, a notable factor in early 2025 is the decline in filed auto physical damage (APD) claims, which were down 9% YoY in Q1 2025. This is attributed to consumer economic sensitivity leading to higher deductibles, reduced coverage, and an increase in self-pay for minor damages. Management expects this headwind to persist through 2025, which has led to a slight moderation in the core revenue growth outlook for the year, although the overall revenue guidance was increased due to the EvolutionIQ contribution.
2. Cost Structure & Margins:
CCCS's cost structure primarily comprises the cost of revenue (hosting, support, deployment) and operating expenses (R&D, SG&A).
Gross Profit and Margin: GAAP Gross Profit has steadily increased from $424.3 million in FY2020 to $713.8 million in FY2024. The GAAP Gross Margin has shown improvement, expanding from 67.0% in FY2020 to 75.5% in FY2024. In Q1 2025, GAAP Gross Profit was $185.0 million, maintaining a 73.6% margin, consistent with Q1 2024. Adjusted Gross Margin, which excludes items like stock-based compensation and amortization of acquired intangibles within cost of revenue, has consistently been higher, typically ranging from 75% to 79% over the period. In Q1 2025, the adjusted gross margin was 76.5%, slightly down from 77.9% in Q1 2024, primarily attributed to increased depreciation expense.
Operating Expenses:
Research and Development (R&D): R&D expenses have consistently increased, reflecting CCCS's focus on innovation and product development. GAAP R&D rose from $110.0 million in FY2020 to $201.5 million in FY2024. Management has stated that over $1 billion has been invested in R&D over the past decade.
Sales, General & Administrative (SG&A): GAAP SG&A expenses were $360.4 million in FY2024. This category includes sales and marketing, general corporate expenses, and a significant amount of stock-based compensation. For example, stock-based compensation was a notable 24% of revenue in Q1 2025, though management expects this to moderate to the low teens by year-end.
Operating Income and Margin: GAAP Operating Income has been volatile. It was $77.0 million in FY2020, turned to a loss of $144.7 million in FY2021 (largely due to SPAC-related costs and stock-based compensation), recovered to $51.9 million in FY2022, fell to a loss of $23.9 million in FY2023 (due to the $82.7 million China-related impairment charge), and recovered again to $80.1 million in FY2024. This translates to a GAAP Operating Margin of 8.5% in FY2024. In Q1 2025, CCCS reported a GAAP Operating Loss of $10.7 million. Adjusted Operating Income provides a clearer view of underlying operational profitability by excluding non-recurring items and certain non-cash charges. This metric has shown more consistent growth.
Net Margin: GAAP Net Margin has mirrored the volatility of GAAP Operating Income and Net Income, being significantly impacted by the aforementioned factors.
The improving GAAP gross margins suggest good scalability and pricing power. However, the volatility in GAAP operating and net margins underscores the impact of non-recurring items and high stock-based compensation. Adjusted margins offer a more stable picture of operational efficiency improvements over time.
3. Profitability Metrics:
EBITDA and Adjusted EBITDA: Adjusted EBITDA has shown strong and consistent growth, rising from $202.8 million in FY2020 to $397.4 million in FY2024 (a CAGR of 18.3%). The Adjusted EBITDA margin expanded from 32.0% in FY2020 to 42.1% in FY2024. For Q1 2025, Adjusted EBITDA was $99.1 million, a 5.8% increase from $93.7 million in Q1 2024. The Adjusted EBITDA margin for Q1 2025 was 39.4%, compared to 41.2% in Q1 2024. This slight margin compression was partly due to the initial dilutive impact of the EvolutionIQ acquisition and increased operating expenses related to growth initiatives. Management has guided for a full-year 2025 adjusted EBITDA margin of approximately 40% at the midpoint, which includes the EvolutionIQ impact, suggesting an underlying core business margin expansion.
Net Income (GAAP and Adjusted): GAAP Net Income has been erratic: -$16.9 million (FY2020), -$248.9 million (FY2021), $38.4 million (FY2022), -$90.1 million (FY2023), and $31.2 million (FY2024). The large loss in FY2021 was heavily influenced by costs associated with the SPAC transaction and related stock compensation. The FY2023 loss was driven by the China unit impairment. Adjusted Net Income, which strips out these and other non-recurring/non-cash items, has presented a more consistent picture of growing profitability: $79.3 million (FY2020), $130.3 million (FY2021), $176.4 million (FY2022), $210.5 million (FY2023), and $238.1 million (FY2024). For Q1 2025, adjusted net income was $54.5 million, slightly down from $54.8 million in Q1 2024.
Earnings Growth vs. Revenue Growth: Adjusted EBITDA growth has generally outpaced revenue growth in several years (e.g., FY2024 Adjusted EBITDA up 12% vs. revenue up 9.1%), indicating operating leverage in the business model. However, in Q1 2025, Adjusted EBITDA growth (5.8%) lagged revenue growth (10.7%), which management attributed partly to the dilutive impact of the recent EvolutionIQ acquisition and planned investments.
4. Earnings Per Share (EPS):
GAAP Diluted EPS has reflected the volatility of GAAP Net Income:
FY2020: -$0.03
FY2021: -$0.46
FY2022: $0.06
FY2023: -$0.15
FY2024: $0.04
Weighted Average Diluted Shares Outstanding have increased significantly since the company went public.
FY2020: ~595 million (Basic)
FY2021: ~544 million (Basic), ~595 million (Diluted, Q4)
FY2022: ~608 million (Basic), ~643 million (Annual)
FY2023: ~618 million (Annual)
FY2024: ~611 million (Basic), ~629-650 million
Q1 2025 Diluted Shares: Approximately 659 million.
The increase in shares outstanding has had a dilutive effect on EPS. The company's share repurchase program, which commenced in Q1 2025 with 7 million shares repurchased, aims to partly offset this dilution and return value to shareholders.
B. Balance Sheet Examination:
1. Asset Analysis:
Current Assets: Total Current Assets stood at $297.9 million as of March 31, 2025.
Cash and Cash Equivalents: Fluctuated significantly, influenced by operating cash flows, acquisitions, debt activities, and share repurchases. Cash was $162.1 million at YE 2020, $182.5 million at YE 2021, $323.8 million at YE 2022, $195.6 million at YE 2023, and rose to $399.0 million at YE 2024. As of March 31, 2025 (Q1 2025), cash and cash equivalents were $130.3 million. The decrease from YE 2024 to Q1 2025 is primarily due to the cash portion of the EvolutionIQ acquisition and share repurchases.
Accounts Receivable: Net Accounts Receivable have grown broadly in line with revenue, from $85 million at YE 2020 to $114 million at YE 2024. As of Q1 2025, they were $99.6 million.
Non-Current Assets:
Goodwill and Intangible Assets: These form a substantial portion of Total Assets, which is typical for companies that have grown through acquisitions.
Net Property, Plant & Equipment (PP&E): Relatively modest for a SaaS company.
Total Assets were $3.20 billion at YE 2020, $3.24 billion at YE 2021, $3.35 billion at YE 2022, $3.05 billion at YE 2023, and $3.18 billion at YE 2024. The significant weight of Goodwill and Intangibles carries the risk of future impairments if acquired assets underperform or market conditions deteriorate.
2. Liabilities & Capital Structure:
Total Liabilities: Were $1.81 billion at YE 2020, decreasing to $1.16 billion by YE 2024. As of March 31, 2025, Total Liabilities were approximately $1.27 billion.
Debt: Total Debt was $792.0 million at YE 2022, $784.0 million at YE 2023. As of March 31, 2025, Total Debt increased to $998.5 million. This increase in Q1 2025 is likely attributable to financing a portion of the EvolutionIQ acquisition and share repurchases.
Equity Structure: Total Equity stood at $1.37 billion at YE 2020, increasing to $2.00 billion by YE 2024. As of March 31, 2025, Total Equity was approximately $2.02 billion (based on Q1 2025 Balance Sheet in 10-Q). Retained Earnings have historically been negative (Accumulated Deficit) due to cumulative net losses in prior periods, a common feature for companies with significant non-cash expenses like stock-based compensation post-SPAC or one-time charges.
Key Ratios:
Debt-to-Equity Ratio: Based on YE 2024 figures ($808M LT Debt / $2.00B Equity) is approximately 0.40. Using Total Debt of $998.5M and Equity of ~$2.02B for Q1 2025, the ratio is ~0.49. This indicates a moderate level of leverage.
Interest Coverage Ratio (GAAP Operating Income / Interest Expense): For FY2024, this was $80.1 million / $64.6 million = 1.24x. This is a relatively low coverage ratio based on GAAP operating income, highlighting the company's reliance on adjusted EBITDA for demonstrating debt service capacity. Q1 2025 GAAP operating loss implies negative coverage.
Net Leverage (Net Debt / Adjusted EBITDA): This stood at 2.2x at the end of Q1 2025, up from a net cash position at YE 2024 due to the debt increase.
3. Liquidity Metrics:
Current Ratio (Current Assets / Current Liabilities): As of Q1 2025, the current ratio was $297.9 million / $193.8 million = 1.54x. This is generally considered healthy. Historical data also shows current ratios typically above 1.5.
Quick Ratio ((Cash + Accounts Receivable) / Current Liabilities): For Q1 2025, this was ($130.3 million + $99.6 million) / $193.8 million = 1.19x. This also indicates adequate short-term liquidity. Historical data shows quick ratios typically above 1.2. These liquidity metrics suggest that CCCS has maintained a sufficient capacity to meet its short-term obligations throughout the period.
C. Cash Flow Statement Scrutiny:
1. Operating Cash Flow (OCF):
CCCS has demonstrated a strong and consistently growing ability to generate cash from its core operations.
FY2020: $103.9 million
FY2021: $127.3 million
FY2022: $199.9 million
FY2023: $250.0 million
FY2024: $283.9 million For Q1 2025, OCF was $58.5 million, compared to $55.2 million in Q1 2024, showing continued positive generation. Operating Cash Flow has consistently exceeded GAAP Net Income, often by a significant margin. This divergence is primarily due to substantial non-cash expenses such as depreciation and amortization (D&A) and stock-based compensation, which are added back to net income in the OCF calculation. This indicates a high quality of earnings, where underlying cash generation is stronger than reported accounting profits might suggest.
2. Capital Expenditures (CapEx):
Capital expenditures for CCCS, a SaaS company, primarily relate to investments in its technology infrastructure, capitalized software development, and other fixed assets.
FY2020: Approx. $30.6 million
FY2021: Approx. $38.3 million
FY2022: Approx. $47.9 million
FY2023: Approx. $55.0 million
FY2024: Approx. $53.0 million
For Q1 2025, CapEx was approximately $14.9 million
CapEx has remained relatively modest as a percentage of revenue (typically 5-6%), which is characteristic of asset-light SaaS business models. These investments appear sustainable and are crucial for maintaining and enhancing the company's technological capabilities and supporting future growth.
3. Free Cash Flow (FCF):
Free Cash Flow is a critical measure of financial health and flexibility. CCCS has demonstrated a strong and growing FCF profile:
FY2020: $73.3 million
FY2021: $89.0 million
FY2022: $152.0 million
FY2023: $195.0 million
FY2024: $230.9 million
In Q1 2025, FCF was $43.6 million, up from $39.6 million in Q1 2024. The trailing twelve-month (TTM) FCF as of Q1 2025 was $235 million. This robust FCF generation provides CCCS with significant financial flexibility to invest in growth initiatives (both organic R&D and acquisitions like EvolutionIQ), manage its debt obligations, and return capital to shareholders through programs like the recently initiated share repurchase. The FCF Yield (TTM FCF / Current Market Capitalization) using TTM FCF of $235 million and a market capitalization of approximately $5.7 billion (as of May 2025) is approximately 4.1%, a respectable yield that indicates good cash generation relative to its market valuation.
IV. Key Ratios and Trend Analysis
An analysis of key financial ratios provides further insight into CCCS's performance trends regarding profitability, efficiency, and leverage.
A. Profitability Ratios:
Return on Assets: ROA has been volatile due to fluctuations in GAAP Net Income. For FY2024, with Net Income of $31.2M and average assets around $3.1B, ROA was approximately 1.0%.
Return on Equity (ROE = GAAP Net Income / Average Total Equity): Similar to ROA, GAAP ROE has been impacted by net income volatility. For FY2024 ROE was approximately 1.6%. The relatively low GAAP ROA and ROE figures, particularly in years with net losses (FY2021, FY2023), highlight the impact of significant non-cash charges (stock-based compensation, impairments) on reported profitability. Utilizing adjusted net income would yield more indicative ratios of underlying operational returns on assets and equity. For instance, using FY2024 Adjusted Net Income of $238.1M would result in an Adjusted ROE of approximately 12.5%, a more robust figure. The company's ability to translate its strong market position and revenue growth into sustained and improving GAAP profitability will be key to enhancing these return metrics over time.
B. Efficiency & Leverage Ratios:
Leverage Ratios:
Debt-to-Equity Ratio: This was approximately 0.40 at YE 2024 and rose to ~0.49 by Q1 2025, indicating a moderate level of leverage.
Net Debt / Adjusted EBITDA: This ratio stood at 2.2x at the end of Q1 2025. This is a key covenant-related metric for many companies and provides insight into the company's ability to service its debt from its operational earnings. A level of 2.2x is generally considered manageable, though an increase from a prior net cash position warrants monitoring.
C. Trend Analysis:
A consistent upward trend in Total Revenue, with some quarterly fluctuations influenced by seasonality or specific market dynamics like the recent APD claim volume dip.
A strong and generally steeper upward trend in Adjusted EBITDA, indicating improving profitability and operating leverage, although Q1 2025 showed a moderation in growth rate compared to revenue due to acquisition effects.
An expanding Adjusted EBITDA Margin over the years, reflecting cost management and the scalability of the SaaS model, with a slight dip in Q1 2025 guided to recover through the year.
A robust and consistently growing Free Cash Flow, underscoring the business's strong cash-generating capabilities.
V. Qualitative Assessment and Disclosures
A. Analysis of Risk Factors & Contingencies:
The company's 10-K outlines numerous risk factors. Key risks include:
Competition: The P&C insurance technology market is competitive, with established players like Mitchell International and Solera, as well as the potential for new entrants with disruptive technologies.
Customer Concentration: While CCCS serves a broad customer base, the loss of one or more major insurance carriers or MSO (Multi-Shop Operator) customers could adversely affect results. However, high retention rates mitigate this risk to some extent.
Technological Change and Innovation: The industry is subject to rapid technological advancements. CCCS must continue to invest in R&D and innovate effectively to maintain its market leadership and adapt to evolving customer needs, including AI.
Cybersecurity and Data Privacy: As a SaaS provider handling sensitive customer and claims data, CCCS is exposed to cybersecurity threats and must comply with stringent data privacy regulations. A breach could lead to significant financial and reputational damage.
Acquisition Integration: The successful integration of acquired businesses, such as EvolutionIQ, and the realization of anticipated synergies involve execution risks.
Macroeconomic Conditions: Economic downturns, inflation, and interest rate fluctuations can impact customer IT spending, M&A activity, and, as currently observed, insurance claim volumes. The decline in APD claim frequency is a present manifestation of this risk.
Reliance on P&C Insurance Industry: CCCS's performance is closely tied to the health and dynamics of the P&C insurance industry, including claim frequency and severity trends. No material contingencies beyond ordinary course of business litigation were prominently highlighted in the recent earnings materials.
B. Evaluation of Management's Discussion and Analysis (MD&A):
Management's commentary in earnings calls and MD&A sections of SEC filings provides valuable context. Key themes from recent discussions (particularly Q4 2024 and Q1 2025) include:
Navigating Complexity: Management consistently emphasizes CCCS's role in helping clients manage the increasing complexity within the P&C insurance economy, driven by factors like advanced vehicle technology, labor shortages, inflation, and evolving consumer expectations.
CCC as an Innovation Platform: The company positions itself as a long-term innovation partner for its clients, with the CCC IX Cloud and AI-driven solutions being central to this strategy.
Growth in Newer Solutions: Strong progress and adoption are reported for newer solutions like the Intelligent APD Suite, AI-powered subrogation tools, diagnostics, and Mobile Jumpstart. The acquisition of EvolutionIQ is highlighted as a key driver for future growth in the casualty segment.
Macroeconomic Headwinds: Management acknowledges the current macroeconomic uncertainties and their impact, particularly the observed decline in APD claim volumes due to consumer behavior. They expect this pressure to continue in the near term but express confidence in the business's resilience and long-term growth drivers.
Operational Efficiency and Margin Expansion: While investing in growth, management also focuses on operational efficiency, as evidenced by the expansion of adjusted EBITDA margins over time. The guidance for FY2025 suggests continued core margin improvement, even with the initial dilutive impact of EvolutionIQ. Management's narrative generally aligns with the quantitative results when considering adjusted figures. Their confidence in navigating current headwinds is based on the mission-critical nature of their solutions, strong customer relationships, and the ongoing digital transformation trend in the industry.
VI. Competitive Benchmarking
Comparing CCCS to its peers provides context for its performance and valuation. However, direct publicly traded comparables with an identical business model are scarce.
A. Comparison of Key Financial Metrics with Peers:
The primary direct competitors for CCCS in the auto physical damage (APD) claims software market are Mitchell International (part of Enlyte) and Solera Holdings. Enlyte was formed by the merger of Mitchell, Genex, and Coventry. Mitchell International reported revenues of $750 million in 2024. Solera Holdings reported revenues of $2.44 billion for the year ended March 31, 2024. Both Enlyte and Solera have been through private equity ownership and have complex capital structures, making direct public financial comparisons challenging.
For broader SaaS company comparisons, metrics such as revenue growth, gross and EBITDA margins, R&D spending, and valuation multiples (P/S, EV/EBITDA) are relevant.
Revenue Growth: CCCS's revenue growth (9.1% in FY2024, 10.7% in Q1 2025 YoY) is solid for a company of its scale in a mature, albeit transforming, industry.
Margins: CCCS's Adjusted Gross Margins (around 77-78%) and Adjusted EBITDA Margins (around 40-42%) are strong and indicative of a healthy SaaS model with good operating leverage. These margins would likely compare favorably to many vertical SaaS peers.
R&D Investment: R&D as a percentage of revenue for CCCS was approximately 21.3% in FY2024 ($201.5M / $944.8M), reflecting its commitment to innovation.
Valuation Multiples: As of May 2025, CCCS trades at a Price/Sales (TTM) ratio of around 5.3-6.1x and a Price/FCF (TTM) of around 21.9-25.2x. Its forward P/E is estimated around 22x. These multiples are generally in line with or slightly below some high-growth SaaS companies, potentially reflecting its more mature core market but also its consistent profitability and cash flow.
B. Assessment of Market Position Shifts: Over the past five years, CCCS appears to have solidified its strong market position within the North American APD insurance ecosystem. The company has consistently grown its network of repair facilities and parts suppliers. Its high customer retention rates and NPS scores suggest a loyal customer base and a strong value proposition. The strategic focus on AI and the introduction of new solutions like Estimate-STP, Mobile Jumpstart, and advanced diagnostics have likely enhanced its competitive standing by addressing key industry pain points such as efficiency and labor shortages. The acquisition of EvolutionIQ is a significant strategic move that could shift its market position in the broader insurance technology landscape by providing a strong entry into the casualty and workers' compensation AI solutions market. This diversifies its offerings beyond APD and positions it to capture growth in another complex and data-intensive segment of the insurance industry. CCCS's consistent revenue growth, network expansion, and strategic acquisitions suggest it is effectively competing and likely maintaining or growing its share in core areas while expanding into new ones.
VII. Valuation Analysis
This section provides an estimate of CCC Intelligent Solutions Holdings Inc.'s intrinsic value using Discounted Cash Flow (DCF) analysis, Owner Earnings valuation, and Relative Valuation, along with a projected 5-year forward Internal Rate of Return (IRR).
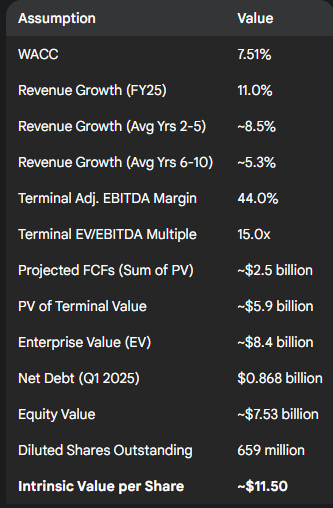
A. Discounted Cash Flow (DCF) Valuation:
The DCF analysis indicates an intrinsic value per share of approximately $11.50.

B. Relative Valuation:
Comparing CCCS's current valuation multiples to its historical ranges and peers:
Forward P/E (Adjusted): Approximately 22.1x
P/S (TTM): Current P/S is 5.9x.
EV/Adjusted EBITDA (TTM): 16.3x.
P/FCF (TTM): 24.3x. This is a reasonable multiple for a company with strong FCF generation and growth.
Relative to its own history, current multiples are off their peaks seen in 2021 but reflect a more normalized valuation for a company delivering consistent growth and profitability on an adjusted basis. Compared to high-growth SaaS peers, CCCS might appear less expensive on some metrics, reflecting its more moderate growth rate but stronger profitability.
C. Projected 5-Year Forward Internal Rate of Return (IRR):
Based on the current market capitalization of ~$5.70 billion (approx. $8.65 per share as of mid-May 2025 for calculation consistency with potential report finalization date), the projected FCFs from the DCF model for the next 5 years (FY2025-FY2029), and a terminal equity value at the end of FY2029 (derived from the DCF's terminal enterprise value, adjusted for projected net debt at that time, consistent with a 15.0x EV/EBITDA exit).
Projected FCFs (Equity FCF after interest, taxes, and net debt impact on FCFF):
FY2025: ~$200M
FY2026: ~$230M
FY2027: ~$265M
FY2028: ~$300M
FY2029: ~$335M
Terminal Equity Value at end of FY2029 (based on 15.0x EV/EBITDA exit, less projected net debt): ~$8.5 billion. The projected 5-Year Forward IRR is approximately 10-12%.
Table VII.4: 5-Year Forward IRR Calculation Summary

VIII. Overall Health, Growth, and Future Outlook
A. Holistic View of Financial Health:
CCC Intelligent Solutions exhibits a generally solid financial health profile, characterized by a consistent track record of revenue growth, robust and expanding adjusted EBITDA margins, and strong free cash flow generation. The company's SaaS model, with its high proportion of recurring revenue and strong customer retention (99% gross dollar retention), provides a stable financial foundation. Liquidity, as measured by current and quick ratios, remains healthy.
However, GAAP profitability has been inconsistent, with net losses reported in FY2021 and FY2023, primarily due to significant non-cash stock-based compensation expenses following its 2021 SPAC merger and a one-time goodwill impairment charge in FY2023. While GAAP net income was positive in FY2022 and FY2024, the levels are modest relative to revenue. The increase in total debt to nearly $1 billion and net leverage to 2.2x adjusted EBITDA in Q1 2025, following the EvolutionIQ acquisition and share repurchases, warrants monitoring, although it remains within manageable levels for a company with its cash flow profile. The low GAAP interest coverage ratio is a point of attention, emphasizing the importance of sustained growth in adjusted EBITDA to comfortably service debt. Current macroeconomic headwinds, particularly the decline in APD claim volumes, also pose a near-term challenge to revenue growth momentum.
B. Assessment of Growth Sustainability and Key Drivers:
The growth trajectory of CCCS appears sustainable in the long term, underpinned by several key drivers:
Ongoing Digitization of P&C Insurance: The P&C insurance economy is still in the relatively early stages of a broad digital transformation, with significant runway for adoption of cloud-based platforms and AI-driven solutions. CCCS is a prime beneficiary of this secular trend.
Leadership in AI Solutions: The company's continuous investment in AI and its expanding suite of AI-powered tools (e.g., Estimate-STP, diagnostics, subrogation, and now casualty solutions via EvolutionIQ) address critical industry needs for efficiency and accuracy, driving adoption.
Network Effects: The extensive and growing multi-sided network of insurers, repairers, OEMs, and parts suppliers creates significant competitive moats and opportunities for cross-selling and upselling.
Expansion into Adjacencies: The strategic move into casualty claims with EvolutionIQ opens up a substantial new addressable market and diversifies revenue streams.
Strong Customer Relationships and Retention: High gross and net dollar retention rates (NDR of 107% in Q1 2025) demonstrate the value customers derive from CCCS's platform and their willingness to expand their usage. Potential constraints to growth include the aforementioned macroeconomic pressures on claim volumes, execution risks associated with integrating new acquisitions and launching new products, and the persistent threat of competition in a dynamic technology landscape. However, the company's established market position and innovation capabilities position it well to navigate these challenges.
C. Future Outlook: Strengths, Weaknesses, Opportunities, and Threats (SWOT Analysis):
Strengths:
Dominant market leadership in North American APD claims technology.
Extensive and deeply integrated multi-sided network creating strong network effects.
Proprietary data assets (over $1 trillion in historical data) fueling AI development.
Advanced and expanding AI capabilities across the claims lifecycle.
High customer retention rates and recurring revenue model (primarily SaaS).
Consistent and strong free cash flow generation.
Experienced management team with deep industry knowledge.
Weaknesses:
Historically volatile GAAP profitability, impacted by non-cash charges and one-time events.
Significant portion of assets in goodwill and intangibles, carrying impairment risk.
Current sensitivity to auto claim volume fluctuations.
High levels of stock-based compensation impacting GAAP EPS.
Increased net leverage following recent acquisition and share repurchases.
Opportunities:
Continued secular trend of digital transformation in the P&C insurance economy.
Growing adoption of AI and automation across all segments of the insurance value chain.
Significant expansion potential in the casualty and workers' compensation segments via EvolutionIQ.
Further penetration of existing customer base with new and enhanced solutions (cross-sell/upsell).
Expansion of parts procurement solutions and other value-added services for repairers and suppliers.
Potential for international expansion beyond the core North American market over the long term.
Leveraging the CCC IX Cloud for new applications and data monetization opportunities.
Threats:
Prolonged or worsening macroeconomic downturn impacting claim volumes and customer IT budgets.
Intensifying competition from existing players or new, disruptive entrants.
Challenges in successfully integrating EvolutionIQ and realizing synergies.
Changes in regulatory landscape affecting the insurance or automotive industries.
Data security breaches or cyberattacks compromising sensitive information.
Slower-than-anticipated adoption of new technologies by the insurance industry.