


Vertiv's Thermal Edge: Can It Sustain Growth as Data Centers Densify?
Buy

1. Summary
Overview: Vertiv Holdings Co. (Vertiv) is a global leader in providing critical digital infrastructure and continuity solutions, essential for the seamless operation of data centers, communication networks, and commercial/industrial facilities.
Key Findings Snapshot: The analysis reveals a company experiencing robust revenue growth, particularly driven by the surging demand from artificial intelligence (AI) and high-density computing. Vertiv has demonstrated significant margin expansion and a marked improvement in free cash flow generation over the past two years. Operational efficiencies, partly driven by the Vertiv Operating System (VOS), and strategic supply chain management have contributed to this performance. The company is well-positioned to capitalize on secular trends in data center build-outs, with its strong portfolio in power and thermal management, especially in advanced liquid cooling solutions.
Valuation Summary: Based on a Discounted Cash Flow (DCF) analysis, the intrinsic value of Vertiv is estimated to be in the range of $115 - $135 per share. An Owner Earnings valuation provides a more conservative estimate, suggesting a value closer to $98 per share based on 2024 earnings. The projected 5-year Internal Rate of Return (IRR) based on the DCF model and current market price suggests an attractive potential return.
Investment Thesis: Vertiv presents a compelling investment opportunity (BUY rating) driven by its strong leverage to the secular growth in data center infrastructure, particularly the AI-driven demand for specialized power and cooling solutions. The company's improving financial metrics, strategic acquisitions, key technology partnerships, and focused operational execution position it for sustained growth and value creation.
Core Recommendations:
Initiate or add to positions in Vertiv stock, considering the long-term growth trajectory of the digital infrastructure market.
Monitor key performance indicators including order growth, backlog conversion, adjusted operating margin trends, and the adoption rate of its liquid cooling solutions.
Closely watch the company's ability to manage ongoing tariff impacts and integrate recent acquisitions effectively.
Key Risks: Significant risks include a potential slowdown in AI-related capital expenditures, increased competition from larger, more diversified players, execution risks associated with rapid scaling and large projects, and ongoing geopolitical tensions impacting supply chains and tariffs.
2. Get Oriented: Business & Industry Overview, Context Setting
2.1. Vertiv's Corporate Journey and Public Listing:
Vertiv's lineage traces back to Emerson Network Power, a segment of Emerson Electric. In December 2016, Platinum Equity acquired this business, rebranding it as Vertiv. Vertiv launched as a standalone entity with a focus on critical digital infrastructure. A pivotal moment in its recent history was its public listing on the New York Stock Exchange (NYSE) under the ticker VRT on February 10, 2020, achieved through a merger with GS Acquisition Holdings Corp, a Special Purpose Acquisition Company (SPAC) led by Goldman Sachs. This transition to a publicly traded company set the stage for its performance and strategic evolution over the past five years.
2.2. Business Model: Powering the Digital World:
Vertiv operates at the core of the digital economy, specializing in the design, manufacture, and servicing of critical infrastructure technologies essential for data centers, communication networks, and various commercial and industrial facilities. Its comprehensive portfolio is broadly categorized into:
Power Management: Including uninterruptible power supplies (UPS), switchgear, busway systems, and power distribution units (PDUs).
Thermal Management: Encompassing precision cooling systems, in-row cooling, rack cooling, chillers, and increasingly, advanced liquid cooling solutions (e.g., direct-to-chip, immersion cooling).
IT Infrastructure Solutions & Services: Comprising racks, enclosures, monitoring software (like Data Center Infrastructure Management - DCIM), and a suite of services including preventative maintenance, project services, and aftermarket support.
Revenue is primarily generated from two streams: the sale of Products (which formed the bulk of 2024 revenue with $6.39 billion) and Services ($1.62 billion in 2024). A notable strategic development has been Vertiv's evolution from primarily a product supplier to an provider of integrated solutions and comprehensive services. This shift is critical as customers, particularly in the hyperscale and AI segments, demand holistic solutions to manage the increasing complexity and rapid deployment timelines of modern data centers. By enhancing its service offerings across its entire portfolio and bolstering project management capabilities, Vertiv aims to capture greater value, foster deeper customer relationships, and secure more stable, recurring revenue streams.
2.3. Operational Segments:
Vertiv reports its financial performance across three primary geographic segments:
Americas (AMER): This is Vertiv's largest segment, accounting for 56% of its revenue in 2024.
Asia Pacific (APAC): Contributing 22% of revenue in 2024.
Europe, Middle East & Africa (EMEA): Also contributing 22% of revenue in 2024. This geographical diversification provides some resilience against regional economic fluctuations, although the Americas currently represent the dominant market for the company.
2.4. Industry Positioning and Key Market Trends:
Vertiv operates in a dynamic and rapidly expanding industry, shaped by several powerful trends:
Explosive Data Center Growth: The global demand for data processing and storage continues to surge, driven by cloud computing, widespread digitization, and, most significantly, the AI revolution. Global spending on digital transformation is forecast to reach $2.8 trillion in 2025, more than double the amount from 2020.
AI and High-Density Computing: The proliferation of AI applications and accelerated computing workloads is fundamentally reshaping data center design. Rack power densities are increasing dramatically (e.g., from 25-40 kW to 130 kW and potentially much higher per rack), necessitating advanced power infrastructure and a shift from traditional air cooling to more efficient liquid cooling technologies.
Energy Availability and Efficiency: Power is becoming a critical bottleneck for data center expansion, with global data center energy consumption projected to double by the end of the decade. This drives demand for highly energy-efficient power and cooling solutions, and exploration of alternative energy sources like fuel cells and small modular reactors (SMRs).
Sustainability and Regulatory Focus: There is growing scrutiny from governments and the public on the environmental impact of data centers, particularly their energy and water consumption. This is leading to new guidelines and regulations promoting sustainable AI practices and energy efficiency.
Vertiv is strategically positioned as a key enabler of these trends, offering a comprehensive suite of power and thermal management solutions tailored for these evolving demands. The company has placed a strong emphasis on innovation, particularly in liquid cooling and solutions for high-density environments. The transition to AI-driven high-density computing is a pivotal moment for the industry. Vertiv's proactive investments in liquid cooling technologies, evidenced by acquisitions like CoolTera and partnerships with chip giants like NVIDIA, signal a strategic intent to lead in this critical market segment. This focus could allow Vertiv to capture a significant share of the high-value infrastructure required for AI, differentiating it from competitors slower to adapt to this technological inflection point.
2.5. Competitive Landscape:
The critical digital infrastructure market is competitive, featuring established global players. Vertiv's main competitors include Schneider Electric, Eaton Corporation, Dell Technologies, Johnson Controls, Huawei, and ABB.
Vertiv seeks to differentiate itself through:
A holistic and integrated approach, offering end-to-end solutions spanning power, cooling, and IT infrastructure.
Advanced digital engineering capabilities and a strong focus on innovation, particularly in high-density and liquid cooling.
A global service network with approximately 4,200 field service technicians in over 130 countries.
The ability to scale production and deliver solutions globally, which is critical for hyperscale and large colocation customers.
While competition is robust, the projected size of the AI infrastructure opportunity (estimated at $1.5 trillion) suggests ample room for multiple well-positioned players. Vertiv's specialization in high-density solutions and its capability to deliver complex integrated systems on a global scale may provide a competitive advantage, particularly against firms with a broader, less specialized focus or those with more limited global operational reach. This specialization allows Vertiv to target the most complex and rapidly expanding segment of the market, where deep technical expertise and integrated solutions are paramount.
2.6. Significant Strategic Changes Since IPO (2020-Present):
Since going public, Vertiv has undertaken several strategic initiatives to strengthen its market position and capitalize on growth opportunities:
Strategic Acquisitions:
E+I Engineering Group (November 2021): Acquired for approximately $1.8 billion plus a potential $200 million earnout, this significantly expanded Vertiv's in-building power distribution portfolio, adding critical capabilities in switchgear, busway, and modular power solutions. This acquisition was aimed at providing a more complete power train solution to customers.
CoolTera Ltd. (December 2023): A UK-based provider of coolant distribution infrastructure, this acquisition bolstered Vertiv's thermal management portfolio, specifically enhancing its capabilities in liquid cooling for high-density compute requirements.
BiXin Energy (BSE) Assets (December 2024): Acquisition of certain assets and centrifugal chiller technology from this China-based manufacturer broadened Vertiv's global chiller offerings, supporting high-performance compute and AI applications with solutions up to 5.5 MW.
Key Technology Partnerships: Vertiv has actively pursued collaborations with leading technology players. Most notably, its partnership with NVIDIA has deepened, making Vertiv an NPN Solution Advisor and co-developing reference designs for NVIDIA's advanced GPU platforms like the GB200 and GB300 NVL72. Other significant collaborations include those with Intel for Gaudi3 AI accelerator cooling, Cisco for edge computing, HPE for hybrid cloud solutions, and Compass Datacenters for AI-ready infrastructure.
Operational Excellence and Supply Chain Resilience: A core focus has been the implementation of the Vertiv Operating System (VOS) to drive efficiency and productivity across its global operations. In response to geopolitical and trade dynamics, Vertiv has been diversifying its supply chain and adopting a "region-for-region" manufacturing strategy to mitigate risks and manage tariff impacts.
Intensified Innovation Drive: Vertiv has consistently invested approximately 5% of its sales in research and development. This investment is directed towards developing next-generation solutions for liquid cooling, AI factories, and enhanced energy efficiency, supported by a portfolio of approximately 3,000 registered patents.
These strategic moves, particularly the targeted acquisitions and key partnerships, are not isolated events but part of a cohesive strategy. The acquisitions of E+I Engineering, CoolTera, and BSE assets directly address critical gaps or accelerate entry into high-growth segments of the power and thermal management chain essential for AI data centers. E+I provided crucial upstream power distribution capabilities, while CoolTera and BSE significantly enhance Vertiv's liquid cooling and advanced chiller portfolios. When combined with deep collaborations with chip industry leaders like NVIDIA, this "build and partner" approach is enabling Vertiv to construct a more comprehensive and competitive solutions stack, allowing it to address the multifaceted needs of AI-driven data centers more effectively than relying solely on organic growth or selling standalone products. This strategic agility and foresight are positive indicators for the company's future.
3. Analyze the Income Statement (FY 2020 - FY 2024, Q1 2025 TTM)
3.1. Revenue Trends and Growth Drivers:
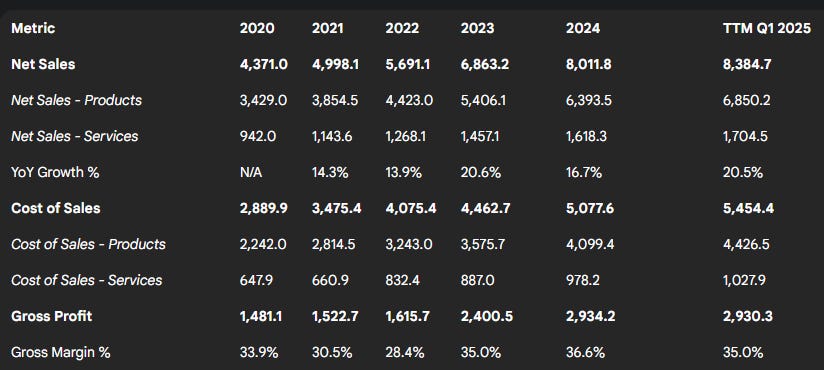
Vertiv's net sales have demonstrated a strong upward trajectory since its public listing, accelerating significantly in recent years.
FY 2020 Net Sales: $4,371.0 million
FY 2021 Net Sales: $4,998.1 million (14.3% YoY growth)
FY 2022 Net Sales: $5,691.1 million (13.9% YoY growth)
FY 2023 Net Sales: $6,863.2 million (20.6% YoY growth)
FY 2024 Net Sales: $8,011.8 million (16.7% YoY growth)
Q1 2025 Net Sales: $2,036.0 million (24.2% YoY growth vs Q1 2024)
This growth has been fueled by robust demand across Vertiv's key end markets, including data centers (hyperscale, cloud, and colocation), telecommunications, and commercial/industrial applications. The acquisition of E+I Engineering in late 2021 also contributed to inorganic growth, particularly in 2022. However, organic growth has remained strong, especially with the recent surge in AI-related infrastructure spending.
A key indicator of future revenue is Vertiv's order intake and backlog. The company reported a record backlog of $5.5 billion at the end of Q4 2023, which grew further to $7.9 billion by the end of Q1 2025. The book-to-bill ratio, a measure of orders received relative to units shipped and billed, was a healthy 1.3x in Q4 2023 and 1.4x in Q1 2025. These figures, particularly the accelerating revenue growth in 2023 and 2024 alongside a rapidly expanding backlog, strongly suggest that Vertiv is effectively capitalizing on the heightened demand for AI infrastructure. This robust demand environment provides good near-term revenue visibility.
3.2. Cost Structure Analysis:
Vertiv's cost of sales has naturally increased with higher revenues, comprising costs for both products and services.
Cost of Sales (FY24): $5,077.6 million
Cost of Sales (FY23): $4,462.7 million
Operating expenses include Selling, General & Administrative (SG&A), Research & Development (R&D), amortization of intangibles, and restructuring costs.
SG&A (FY24): $1,374.0 million
SG&A (FY23): $1,312.3 million
Amortization of Intangibles (FY24): $184.2 million
Amortization of Intangibles (FY23): $181.3 million
Management has emphasized operational excellence through the Vertiv Operating System (VOS) and productivity initiatives to manage costs. The company has also faced challenges from inflation, supply chain disruptions, and tariffs, implementing mitigation strategies such as strategic sourcing and pricing actions. While SG&A has grown in absolute terms, its growth relative to revenue and the continuous focus on operational efficiency suggest the potential for operating leverage as the company continues to scale. Vertiv's consistent investment in R&D, approximately 5% of sales, is a critical component of its cost structure, necessary for maintaining technological leadership and driving future innovation in a rapidly evolving industry.
3.3. Gross, Operating, and Net Profit Margins:
Vertiv has demonstrated an improvement in its profitability margins.
Gross Profit Margin:
FY 2020: 33.9%
FY 2021: 30.5%
FY 2022: 28.4%
FY 2023: 35.0%
FY 2024: 36.6%
Q1 2025: 33.7%
Operating Profit Margin (GAAP):
FY 2020: 4.9%
FY 2021: 5.2%
FY 2022: 3.9%
FY 2023: 12.7%
FY 2024: 17.1%
Q1 2025: 14.3%
Net Profit Margin (GAAP):
FY 2020: -7.5%
FY 2021: 2.4%
FY 2022: 1.3%
FY 2023: 6.7%
FY 2024: 6.2%
Q1 2025: 8.1%
The company highlights its adjusted operating margin, which reached approximately 19.4% in 2024, a significant expansion of around 410 basis points from the previous year. For Q1 2025, the adjusted operating margin was 16.5%, expanding 130 basis points year-over-year despite tariff headwinds. This substantial improvement in margins, particularly in 2023 and 2024, underscores strong pricing power, favorable product mix, benefits from operational leverage as sales volumes increased, and successful cost management initiatives. It indicates that Vertiv is effectively translating strong market demand into enhanced profitability, rather than just pursuing volume growth.
3.4. Profitability Metrics (Net Income, EBITDA):
Net income has shown volatility, partly due to non-recurring items, but the underlying trend in adjusted profitability is positive.
Net Income (Loss) (FY24): $495.8 million
Net Income (Loss) (FY23): $460.2 million
Net Income (Loss) (FY22): $76.6 million
Net Income (Loss) (FY21): $119.6 million
Net Income (Loss) (FY20): ($326.7) million
Adjusted operating profit grew 47% to $1,552 million in 2024. Non-recurring items impacting GAAP net income have included restructuring costs, losses on extinguishment of debt, and significant changes in the fair value of warrant liabilities, a carryover from its SPAC merger.
3.5. Earnings Per Share (EPS) Analysis:
Diluted EPS has followed the trend of net income.
Diluted EPS (Q1 2025): $0.42
Diluted EPS (FY24): $1.28
Diluted EPS (FY23): $1.19
Diluted EPS (FY22): $0.20
Diluted EPS (FY21): $0.33
Diluted EPS (FY20): ($1.07)
Table 2

4. Examine the Balance Sheet
4.1. Asset Analysis:
Vertiv's total assets have grown significantly, from $4.66 billion at year-end 2019 to $9.13 billion at year-end 2024, and further to $9.45 billion as of March 31, 2025.
Current Assets: Key components include Cash and Cash Equivalents, Accounts Receivable, and Inventories.
Cash and Cash Equivalents: Stood at $1.23 billion at YE 2024 and $1.47 billion at Q1 2025.
Accounts Receivable (Net): $2.36 billion at YE 2024.
Inventories: Increased from $401.0 million at YE 2019 to $1.24 billion at YE 2024 and $1.38 billion at Q1 2025.
Non-Current Assets: Dominated by Property, Plant & Equipment (PP&E), Goodwill, and Other Intangible Assets.
PP&E (Net): $827.2 million at YE 2024.
Goodwill: Increased substantially from $605.8 million at YE 2019 to $1.32 billion at YE 2024.
Other Intangible Assets (Net): $1.49 billion at YE 2024. The marked increase in Goodwill and Intangible Assets, particularly notable after 2020 (Goodwill rose from $607.2 million in 2020 to $1.33 billion in 2021), directly reflects the impact of significant acquisitions, primarily E+I Engineering. While these assets represent acquired future earning potential and strategic capabilities, they also necessitate ongoing monitoring for potential impairment risks should the anticipated synergies or market conditions not fully materialize.
4.2. Liabilities & Capital Structure:
Current Liabilities: Total current liabilities were $3.10 billion at YE 2024.
Non-Current Liabilities: Long-term debt (net) was $2.91 billion at YE 2024. The "Change in fair value of warrant liabilities" on the income statement corresponds to the warrant liabilities on the balance sheet, a feature of its SPAC origin.
Total Debt: Vertiv's total debt (current + long-term) was $2.19 billion at YE 2020, rising to $3.15 billion at YE 2024. The company has actively managed its debt profile, including a term loan repricing in December 2023 that lowered interest expenses.
Total Equity: Shareholders' equity increased from a deficit of ($704.8) million at YE 2019 (reflecting pre-SPAC merger structure of Vertiv Holdings, LLC) to $2.43 billion at YE 2024, and $2.67 billion at Q1 2025. This growth is attributable to capital contributions from the SPAC merger, subsequent earnings retention (offsetting accumulated deficit), and other equity transactions.
Vertiv's focus on strengthening its balance sheet is evident. The company achieved its net leverage target of 1.0x-2.0x, reporting 1.0x at year-end 2024 and further improving to approximately 0.8x at the end of Q1 2025. This deleveraging significantly enhances financial flexibility, reduces risk, and provides capacity for future growth investments, acquisitions, or increased shareholder returns, as outlined during the November 2024 Investor Day.
4.3. Liquidity Metrics:
Vertiv's liquidity position has strengthened considerably.
Current Ratio (Current Assets / Current Liabilities):
YE 2020: 1.45
YE 2021: 1.45
YE 2022: 1.66
YE 2023: 1.74
YE 2024: 1.65
Quick Ratio (Acid Test): Approximately 1.19 TTM.
Working capital increased from $777.2 million in 2020 to $2.00 billion in 2024.
Total liquidity stood at a strong $2.3 billion at the end of Q1 2025.
This improved liquidity and working capital position, combined with robust cash flow generation, indicates Vertiv is well-equipped to fund its operational needs and growth initiatives without excessive reliance on external financing, thereby reducing financial risk.
4.4. Book Value Analysis:
Book Value Per Share has increased from $1.50 at YE 2020 to $6.39 at YE 2024. However, Tangible Book Value Per Share has remained negative (YE 2020: ($4.09); YE 2024: ($0.98)), primarily due to the substantial amount of goodwill and intangible assets resulting from acquisitions. While not uncommon for acquisitive companies in technology-related sectors, a negative tangible book value underscores the importance of the acquired assets generating sufficient future cash flows to justify their carrying values.
Table 3: Consolidated Balance Sheet Analysis (2019-2024, Q1 2025)
(Values in millions USD, except ratios)

5. Scrutinize the Cash Flow Statement (FY 2020 - FY 2024, Q1 2025 TTM)
5.1. Operating Cash Flow (OCF) Trends and Quality:
Vertiv's ability to generate cash from its core operations has seen a remarkable improvement, especially in the last two fiscal years.
FY 2020 OCF: $208.9 million
FY 2021 OCF: $210.9 million
FY 2022 OCF: ($152.8) million
FY 2023 OCF: $900.5 million
FY 2024 OCF: $1,319.6 million
Q1 2025 OCF: $303.3 million
The negative OCF in 2022 was a period of significant supply chain challenges and inflationary pressures. The dramatic turnaround to strongly positive OCF in 2023 and its further strengthening in 2024 highlight effective management of working capital, improved profitability, and more stable operating conditions.
5.2. Capital Expenditures (CapEx):
Capital expenditures have been on an increasing trend, reflecting investments to support growth and innovation.
FY 2020 CapEx: $52.7 million
FY 2021 CapEx: $84.6 million (includes $73.4M PP&E, $11.2M software)
FY 2022 CapEx: $111.0 million
FY 2023 CapEx: $134.6 million
FY 2024 CapEx: $184.1 million
Q1 2025 CapEx: $36.5 million
Management has guided 2025 capital expenditures to be approximately $275 million, or around 3.0% of sales, with long-term guidance for capex between 2.5% and 3.0% of sales through 2029.
5.3. Free Cash Flow (FCF) Analysis:
Vertiv reports "Adjusted Free Cash Flow," which has shown a strong recovery and growth trend, mirroring OCF improvements.
FY 2020 Adj. FCF: $163.0 million (OCF $208.9M - Capex $52.7M = $156.2M; difference due to Vertiv's specific definition)
FY 2021 Adj. FCF: $136.1 million
FY 2022 Adj. FCF: ($259.8) million (OCF ($152.8M) - Capex $111.0M = ($263.8M))
FY 2023 Adj. FCF: $778.0 million
FY 2024 Adj. FCF: Approximately $1.1 billion (OCF $1319.6M - Capex $184.1M = $1135.5M)
Q1 2025 Adj. FCF: $265.0 million
Management targets a long-term Adjusted FCF conversion rate (as a percentage of adjusted net income) of 95-100% by 2029. The robust FCF generation in 2023 and 2024 is a strong positive, enabling debt reduction, funding of strategic growth initiatives (including capacity expansion and R&D), and potential returns to shareholders. This ability to convert accounting profits into tangible cash is a critical indicator of financial health and value creation potential.
5.4. Financing and Investing Activities:
Net cash from financing activities has fluctuated, reflecting debt management (issuances and repayments) and equity-related transactions post-SPAC merger. Vertiv declared its first annual cash dividend of $0.01 per share in late 2020, and this has subsequently increased, with an annual dividend of $0.15 per share announced in November 2024.
Investing activities have been significantly impacted by acquisitions, notably the $1.8 billion E+I Engineering deal in 2021, and smaller, strategically important acquisitions like CoolTera and BSE assets in 2023 and 2024 respectively.
6. Ratio & Trend Analysis
6.1. Profitability Ratios:
Return on Assets (ROA):
FY 2021: 2.0%
FY 2022: -1.1%
FY 2023: 6.1%
FY 2024: 5.8%
Return on Invested Capital (ROIC):
FY 2024 ROIC: 23.5%.
6.2. Efficiency Ratios:
Asset Turnover:
FY 2024: $8011.8M / $8565.5M (Avg Assets) = 0.94
Inventory Turnover:
2020: 6.8x
2021: 6.5x
2022: 5.7x
2023: 5.2x
2024: 4.8x
The decline in inventory turnover from 6.8x in 2020 to 4.8x in 2024 warrants attention. While a larger backlog might necessitate holding more inventory to ensure timely fulfillment and mitigate supply chain risks, a persistent downward trend could also suggest potential inefficiencies or an increased risk of inventory obsolescence in a technologically dynamic sector. This should be monitored alongside gross margin performance and overall working capital management.
6.3. Leverage Ratios:
Debt-to-Equity Ratio: Total Debt / Total Equity.
YE 2020: 4.27
YE 2021: 2.10
YE 2022: 2.21
YE 2023: 1.46
YE 2024: 1.20
Net Debt-to-EBITDA:
YE 2024 Net Debt: $1,700.5M
FY 2024 Adjusted EBITDA: $1829.3M.
YE 2024 Net Debt/Adj. EBITDA: 0.93x. This aligns with management's reported net leverage of 1.0x.
Interest Coverage Ratio (EBIT/Interest Expense):
FY 2024: $1367.4M (EBIT) / $150.4M (Interest Exp.) = 9.09x.
Morningstar reports TTM Interest Coverage of 8.64x.
The significant improvement in the Debt-to-Equity ratio from 4.27 in 2020 to 1.20 in 2024, and the achievement of the net leverage target (0.93x calculated above, management reports 1.0x at YE24 and 0.8x at Q1 2025), coupled with a strong interest coverage ratio, demonstrates a substantial reduction in financial risk. This deleveraging enhances Vertiv's financial stability and provides greater capacity for future strategic investments or shareholder distributions, as highlighted in the November 2024 Investor Day.
6.4. Trend Analysis:
Overall, the trend analysis shows a company that navigated initial post-SPAC volatility and challenging macroeconomic conditions (2022) to emerge with a significantly stronger financial profile. Revenue growth has accelerated, margins have expanded notably, cash flow generation has become robust, and the balance sheet has been deleveraged.
7. Review Footnotes & Disclosures
7.1. Key Risk Factors & Contingencies:
Vertiv's filings outline numerous risk factors. The most salient include:
Market Risks: Dependence on the data center market, which can be cyclical and influenced by global economic conditions. A slowdown in AI adoption or data center capital expenditures could adversely affect demand.
Operational Risks: Ongoing supply chain disruptions, though mitigated, remain a risk. Managing manufacturing capacity to meet fluctuating demand and executing large, complex projects are critical.
Competitive Risks: The industry is highly competitive, with large, well-capitalized players. Failure to innovate and keep pace with rapid technological changes (e.g., in cooling technologies) could erode market share.
Geopolitical & Regulatory Risks: Vertiv has significant international operations, exposing it to foreign currency fluctuations, political instability, and varying regulatory environments. Tariffs have been a persistent concern, with management actively implementing mitigation strategies. Environmental regulations related to energy consumption and materials are also evolving. The success of tariff mitigation strategies (such as region-for-region manufacturing and pricing actions) is crucial for future profitability. Failure to effectively navigate these could pressure margins.
Financial Risks: Risks associated with indebtedness, including compliance with covenants and exposure to interest rate fluctuations.
8. Benchmark Against Peers (Schneider Electric, Eaton Corp.)
8.1. Selection of Peers:
For benchmarking purposes, Schneider Electric SE (SU.PA) and Eaton Corporation plc (ETN) are considered primary peers. Both are large, global companies with significant overlap with Vertiv in the electrical equipment and data center infrastructure markets, providing relevant comparisons for financial performance and valuation.
8.2. Industry Financial Ratio Comparisons (FY2024):
A comparative analysis of key financial ratios for FY2024 provides context for Vertiv's performance:
Table 6: Peer Benchmarking Matrix (FY2024)

8.3. Market Positioning and Competitive Advantages/Disadvantages: Vertiv's primary competitive advantage in the current market cycle appears to be its specialized focus on critical digital infrastructure, particularly its aggressive and early investments in liquid cooling and high-density power solutions tailored for AI workloads. This specialization allows for deeper domain expertise and potentially faster innovation cycles in this niche compared to more diversified competitors like Schneider Electric and Eaton, whose broader portfolios span multiple industrial and electrical segments. While diversification can offer stability, it might also lead to slower resource allocation and adaptation to rapid shifts in specific sub-segments like AI infrastructure. Vertiv's ability to provide integrated solutions (power, cooling, racks, services) and its global scale are also key differentiators. A potential disadvantage could be its smaller overall scale and R&D budget compared to giants like Schneider and Eaton, which could impact long-term competitiveness across a wider range of technologies if not managed by focused innovation. However, its current strategic partnerships with chip leaders like NVIDIA help to mitigate this by ensuring its solutions are aligned with cutting-edge compute requirements.
9. Qualitative Aspects
9.1. Management Discussion & Analysis (MD&A) Insights:
A review of Vertiv's MD&A sections from recent annual (10-K) and quarterly (10-Q) filings reveals consistent themes. Management has consistently highlighted the robust demand environment, driven by data center construction, cloud adoption, and particularly the transformative impact of AI. They have also detailed strategic responses, including investments in capacity and innovation (especially liquid cooling), and proactive measures to address challenges such as supply chain constraints and tariff implications. This narrative of capitalizing on strong market tailwinds while actively managing operational and external risks suggests a leadership team that is both strategically focused on growth opportunities and diligent in its execution.
9.2. Management's Strategy, Execution Capability, and Outlook:
Vertiv's management, under CEO Giordano Albertazzi and Executive Chairman David Cote, has articulated a clear strategy focused on customer centricity, innovation, operational excellence, fostering a high-performance culture, and maintaining financial strength. The November 2024 Investor Event laid out ambitious long-term financial targets, including achieving 12-14% average annual organic sales growth and an adjusted operating margin of approximately 25% by 2029.
The company's track record in recent years lends credibility to these aspirations. Significant improvements in profitability, cash flow generation, and balance sheet strength demonstrate effective execution. The successful integration of acquisitions like E+I Engineering and the proactive development of solutions for the AI boom further underscore management's capability. While the long-term targets are ambitious and contingent on sustained market growth and continued flawless execution, the recent performance provides a basis for confidence.
9.3. Operational Efficiency and Initiatives:
The Vertiv Operating System (VOS) is a central pillar of the company's efforts to drive continuous improvement in productivity and efficiency across its global operations. In terms of supply chain management, Vertiv has been actively working to enhance resilience and flexibility. This includes diversifying its supplier base and adopting a "region-for-region" manufacturing approach to mitigate geopolitical risks and the impact of tariffs.
Vertiv's innovation pipeline appears robust, with significant R&D investment (around 5% of sales) focused on next-generation power and thermal management solutions, particularly for high-density AI applications. The company holds approximately 3,000 patents, underscoring its commitment to technological leadership.
9.4. Impact of Macroeconomic Factors and Market Dynamics:
While Vertiv benefits from strong secular tailwinds in data center growth, it is not immune to broader macroeconomic factors. Rising interest rates could increase the cost of capital for its customers, potentially impacting data center investment cycles. Inflationary pressures on materials and labor require ongoing cost management and pricing discipline.
The evolution of data center architectures, including the growth of edge computing alongside large centralized facilities, presents both opportunities and challenges. Vertiv's portfolio addresses solutions from the cloud to the edge. Customer concentration does not appear to be an excessive risk, as Vertiv serves a broad range of clients, including major cloud service providers, colocation companies, telecommunication firms, and enterprise customers.
10. Findings
10.1. Overall Assessment of Financial Health:
Vertiv's financial health has demonstrably improved over the past five years, particularly since 2022. Key strengths include:
Strong Revenue Growth: Accelerating top-line growth, driven by robust market demand, especially from AI.
Significant Margin Expansion: Both gross and adjusted operating margins have shown considerable improvement, indicating pricing power and operational efficiencies.
Robust Cash Flow Generation: A strong turnaround in operating and free cash flow provides significant financial flexibility.
Deleveraged Balance Sheet: Net leverage has been reduced to within the company's target range, lowering financial risk. Areas that warranted attention, such as the inventory turnover decline, appear to be managed within the context of a high-growth, strong backlog environment. Past earnings volatility due to non-cash charges (like warrant revaluations) has become less of a concern as the company matures post-SPAC merger.
10.2. Evaluation of Growth Trajectory and Sustainability:
Vertiv's growth trajectory appears strong in the medium term (3-5 years), primarily fueled by the ongoing AI infrastructure build-out and the broader expansion of digital infrastructure. Management's growth targets (12-14% organic CAGR through 2029) are ambitious but appear achievable given current market dynamics and Vertiv's competitive positioning, particularly its leadership in liquid cooling solutions.
The sustainability of current high growth rates and margin levels will depend on several factors:
The longevity and scale of the AI investment cycle.
Vertiv's ability to maintain its innovation lead and adapt to new technologies.
Continued success in operational execution and cost management.
The competitive landscape and pricing pressures. The current AI-driven demand is providing a significant tailwind. For long-term sustainability beyond this initial surge, Vertiv will need to translate its current momentum into enduring market leadership. This involves not only winning new AI factory builds but also capturing the subsequent service, upgrade, and retrofit opportunities, and expanding its footprint in enterprise AI and edge deployments as those markets mature.
10.3. Future Outlook and Key Catalysts/Headwinds:
Positive Outlook & Catalysts:
Continued AI Proliferation: The ongoing global adoption of AI across various sectors is expected to drive sustained demand for high-density data center infrastructure.
Liquid Cooling Adoption: As rack densities increase, liquid cooling is becoming a necessity, and Vertiv is a leading provider of these solutions.
Data Center Modernization and Edge Growth: Aging data centers requiring upgrades and the expansion of edge computing create further opportunities.
New Product Introductions: Continued innovation in power and thermal management solutions.
Operational Leverage: Further benefits from VOS and economies of scale as revenue grows.
Service Business Expansion: Growing the higher-margin service and aftermarket business.
Potential Headwinds & Risks:
Economic Slowdown: A significant global recession could temper data center capital expenditures.
Competition: Intense competition from established players and potentially new entrants.
Execution Risk: Challenges in scaling operations rapidly to meet demand or integrating acquisitions.
Geopolitical and Trade Issues: Renewed supply chain disruptions or adverse tariff developments.
Technological Disruption: Emergence of new, unforeseen technologies that could challenge Vertiv's current product portfolio.
11. Conclusion: Investment Thesis, Valuations, and Recommendations
11.1. Investment Thesis:
BUY. Vertiv Holdings Co. is strategically positioned to be a primary beneficiary of the secular growth in digital infrastructure, significantly accelerated by the demands of artificial intelligence. The company has demonstrated a strong operational turnaround, resulting in impressive revenue growth, substantial margin expansion, robust free cash flow generation, and a significantly deleveraged balance sheet. Its focused strategy on providing critical power and thermal management solutions, particularly its leadership in the nascent and rapidly expanding liquid cooling market, provides a distinct competitive advantage. While risks related to market cyclicality, competition, and execution exist, the current market tailwinds, coupled with management's proven execution capabilities and ambitious yet credible long-term financial targets, suggest a compelling growth story with further upside potential for equity holders.
11.2. Valuation:


11.3. Recommendations & Actionable Insights:
For Potential Investors: Consider initiating positions in Vertiv (VRT) with a long-term investment horizon, targeting the intrinsic value range derived from the DCF analysis ($115-$135). Phased accumulation might be prudent given recent stock volatility.
Key Metrics to Monitor:
Order Growth & Backlog: Continued strength in orders (book-to-bill >1.1x) and backlog conversion are crucial for revenue visibility.
AI-Driven Demand: Track announcements from hyperscalers and AI chip companies regarding capital expenditures and technology roadmaps, as Vertiv's growth is closely tied to this.
Liquid Cooling Adoption: Monitor Vertiv's market share and revenue growth from advanced cooling solutions.
Adjusted Operating Margins: Progress towards the 25% long-term target will be a key value driver.
Free Cash Flow Conversion: Achievement of guided FCF conversion rates.
Tariff Impact & Mitigation: Commentary on the net impact of tariffs and the success of mitigation strategies.
Acquisition Integration: Performance of acquired entities like E+I Engineering, CoolTera, and BSE.
11.4. Key Risks to Investment Thesis:
AI Spending Slowdown: The current thesis heavily relies on sustained, strong growth in AI infrastructure. Any unexpected slowdown or pause in AI-related capital expenditures by major cloud providers could significantly impact Vertiv's growth outlook.
Execution Challenges: Rapid growth and scaling operations to meet surging demand can lead to execution missteps, project delays, or cost overruns, impacting profitability.
Intensified Competition: Larger competitors (Schneider, Eaton) could become more aggressive in the data center space, leading to pricing pressures or market share loss if Vertiv cannot maintain its innovation edge.
Geopolitical & Tariff Volatility: Further escalation of trade tensions or new tariffs could negatively impact costs and supply chain stability, despite current mitigation efforts.
Technological Obsolescence: The data center technology landscape evolves rapidly. Failure to anticipate and adapt to new cooling or power technologies could render existing solutions less competitive.